

Question: question 28&29 You are interested in researching the linear relationship between income and happiness, so you conduct a survey of 45 randomly selected adults, asking
question 28&29
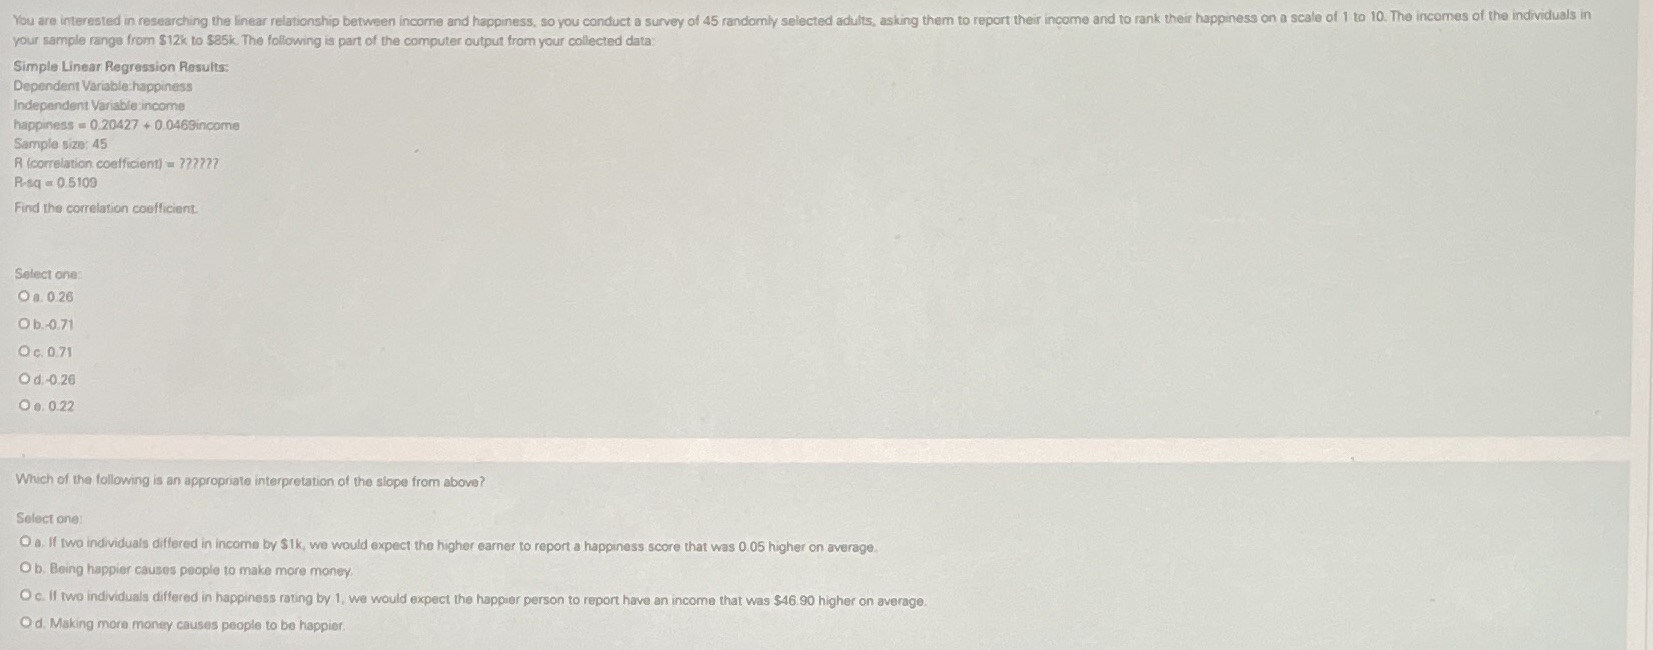
You are interested in researching the linear relationship between income and happiness, so you conduct a survey of 45 randomly selected adults, asking them to report their income and to rank their happiness on a scale of 1 to 10. The incomes of the individuals in your sample range from $12k to $85k. The following is part of the computer output from your collected data Simple Linear Regression Results: Dependent Variable: happiness Independent Variable income happiness = 0.20427 + 0.0469income Sample size: 45 R (correlation coefficient) = ??7??? R-sq = 0.5109 Find the correlation coefficient. Select one O a. 0.26 Ob. -0.71 Oc. 0 71 Od.-0.26 O e. 0.22 Which of the following is an appropriate interpretation of the slope from above? Select one O a. If two individuals differed in income by $ 1k, we would expect the higher earner to report a happiness score that was 0.05 higher on average O b. Being happier causes people to make more money O c. If two individuals differed in happiness rating by 1, we would expect the happier person to report have an income that was $46.90 higher on average O d. Making more money causes people to be happier
Step by Step Solution
There are 3 Steps involved in it

Get step-by-step solutions from verified subject matter experts