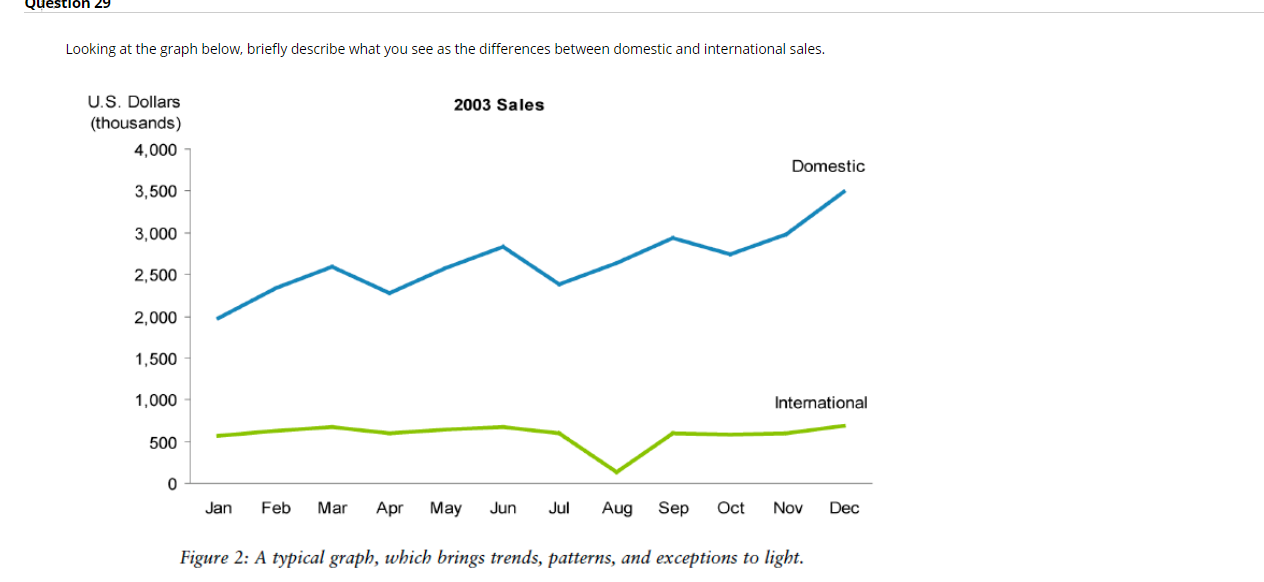
Question: Question 29 Looking at the graph below, briefly describe what you see as the differences between domestic and international sales. 2003 Sales U.S. Dollars (thousands)

Question 29 Looking at the graph below, briefly

Question 29 Looking at the graph below, briefly describe what you see as the differences between domestic and international sales. 2003 Sales U.S. Dollars (thousands) 4,000 Domestic 3,500 3,000 2,500 2,000 1,500 1,000 International 500 0 Jan Feb Mar Apr May Jun Jul Aug Sep Oct Nov Dec Figure 2: A typical graph, which brings trends, patterns, and exceptions to light

Step by Step Solution

There are 3 Steps involved in it

1 Expert Approved Answer
Step: 1 Unlock blur-text-image
Question Has Been Solved by an Expert!

Get step-by-step solutions from verified subject matter experts

Step: 2 Unlock
Step: 3 Unlock

Students Have Also Explored These Related General Management Questions!