Question: Question 2a. Using the Smith Travel Report for the Week of Performance by Industry Segments for the Week of August 08, 2021 - August 14,
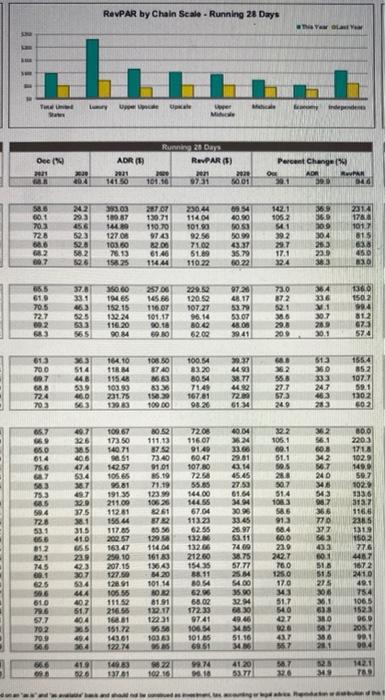
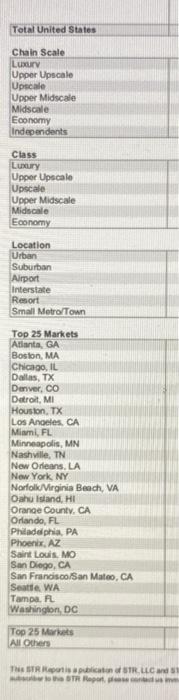
Question 2a. Using the Smith Travel Report for the Week of Performance by Industry Segments for the Week of August 08, 2021 - August 14, 2021; pp. 3.. (provided online) explain which resort(s) is/are performing better overall for Occupancy %, ADR, and Reypac (use the running 28 days of 2021) for the Nashville, Tennessee market. (Value 2 points). Provide detailed justification for your answer. ReVPAR by Chain Scale - Running 28 Days ANTONA lii TU wa uer Independe Dec ( 201 ADR (1 2011 161.50 Running 20 Dave RAPAR (5) 20 2020 100 0731 O 01 Or Percent Change ADA 300 05 RUPAN 04 22 293 00:1 703 728 68.6 62 007 523 52.0 58.2 526 3303 180.87 1418 127.00 103.60 78.13 19825 2017 13071 110.70 974 82. 61.40 11444 230.44 11404 101 90 92.56 710 51.9 110 22 6054 40.00 SOS) 50.90 (3.37 35.79 1021 1052 54.1 192 29.7 17.1 124 359 2314 369176 109101 30.4 815 263 638 239 450 330 6022 3 055 37.8 364 1360 61 331 1562 463 70.5 72.7 002 683 5060 19468 152.15 132.24 116.20 90.84 25700 145.66 116.07 101.17 0.10 69 0 22952 120 52 107 27 06.14 80.42 52.00 9720 48.17 53.79 53.07 48.00 39.41 73.0 872 521 M6 29.8 11 307 289 301 994 812 CZ 574 108.50 613 700 69.7 MS 724 703 3 514 48 539 460 3 CW 164.10 M 115.48 10390 231.75 13083 100.54 8320 80.54 71.49 167.81 0820 2932 44.90 38.77 4492 72.00 6114 688 102 558 27.7 573 24 833 18.30 10000 513 MD 333 24.7 463 283 1564 852 107.7 59.1 1302 802 322 106.1 09.1 51.1 SOS 667 669 65.0 614 75.6 67 583 753 5 59.4 728 53.1 108.67 17350 140 71 sa 51 102.57 105.65 9881 19135 211.00 112.81 156.44 117.85 362 56.1 608 342 567 240 348 385 40.6 474 $3.4 387 49 20 37.5 81 31.5 410 655 229 423 307 CM 80.52 111.13 875 73.40 01.01 85.19 71.19 123 10526 2.61 87 6550 129 114 04 161.00 1543 14.20 101 14 7208 116.07 9140 60.47 107.80 72.54 55.85 144.00 144.95 6704 113.23 62.55 132 132.64 212.00 154 35 88.11 8054 987 366 40.04 2524 33.60 22.81 42.14 45.45 27 53 61.64 3604 3096 33.45 25.97 63.11 74.00 38.75 57.77 25.04 14.00 35.90 3294 68.30 49.46 770 800 2203 1718 1020 149,0 507 102 133.6 3182 116.6 23 1319 1502 776 4487 1672 2410 49.1 507 514 1033 586 913 68.4 60.0 239 2427 760 125.0 170 012 377 663 493 001 518 515 $34 201 745 60.1 25 586 610 NO 57.7 70.2 709 ER 75.4 16347 250.10 207.15 127.50 12891 105.55 11142 216.55 16881 151.72 143 61 122.74 444 402 51,7 404 05 4914 51.7 540 61.91 12.17 12231 5.50 103 63 68.00 17230 9741 106.54 1015 306 2.1 633 380 07 36 201 1065 1523 06 2057 09.1 00.4 51.16 437 567 666 410 2.74 37 14.3 13701 4120 5377 1421 789 M10 RE SK www Total United States Chain Scale Luxury Upper Upscale Upscale Upper Midscale Midscale Economy Independents Class Luxury Upper Upscale Upscale Upper Midscale Midsole Economy Location Urban Suburban Airport Interstate Resort Small Metro/Town Top 25 Markets Atlanta, GA Boston, MA Chicago, IL Dallas, TX Dover, CO Detroit, MI Houston, TX Los Angeles, CA Miami, FL Minneapolis, MN Nashville, TN New Orleans, LA New York, NY Norfolk/Virginia Beach, VA Oahu Island, HI Orange County, CA Orlando, FL Philadelphia, PA Phoenix, AZ Saint Louis, MO San Diego, CA San Francisco San Mateo, CA Seattle, WA Tampa, FL Washington, DC Top 25 Markets All Others The Sports publication of STR. LLC and STR Raport