

Question: . Question 2i ' ( > Suppose a random sample M1374 Californians who own their own homes were surveyed. The table below shows the results
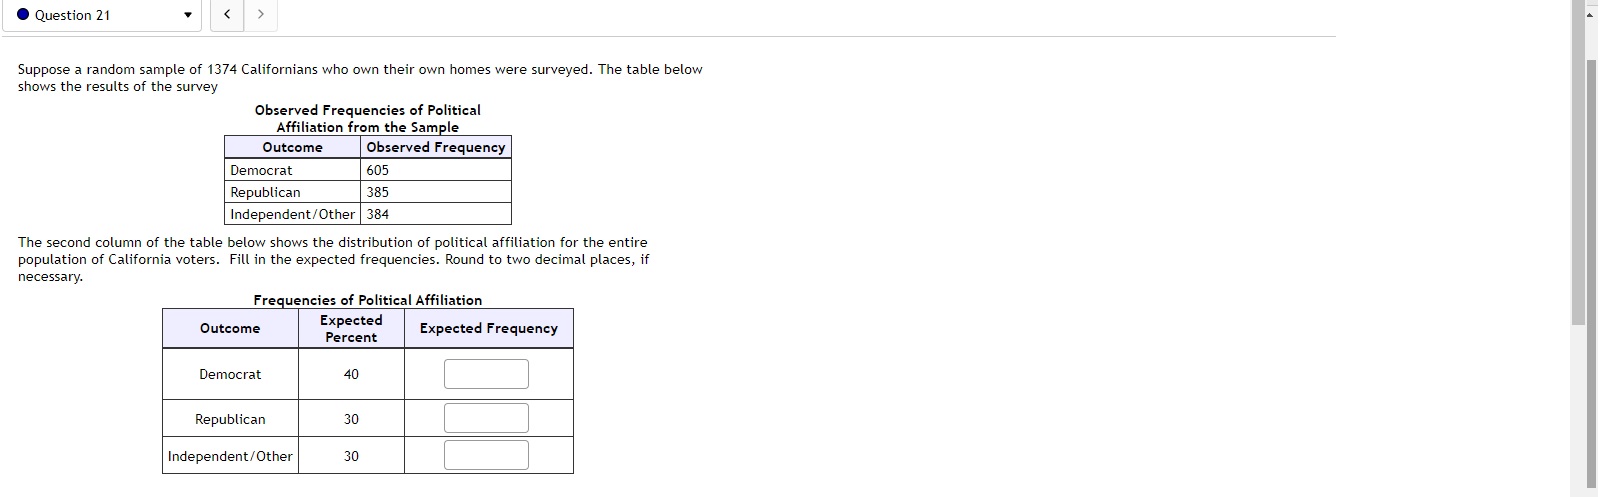
. Question 2i ' ( > Suppose a random sample M1374 Californians who own their own homes were surveyed. The table below shows the results of the survey Observed Frequencies of Political Affiliation from the Sample Outcome Observed Frequency Democrat (:05 Republican 385 Independent/Other 384 The second column of the table below shows the distribution of political affiliation for the entire population of California voters. Fill in the expected frequencies. Round to two decimal places, if necessary. Frequencies of Political Affiliation Expected Outcome Percent Expected Frequency Democrat 40 I I Republican 30 I I IndependenUOtner 30
Step by Step Solution
There are 3 Steps involved in it

Get step-by-step solutions from verified subject matter experts