

Question: Question 3 (0.25 points) The box plot represents the weekly salaries (in dollars) of 80 randomly selected employees of a company.The five-number summary that was
Question 3(0.25 points)
The box plot represents the weekly salaries (in dollars) of 80 randomly selected employees of a company.The five-number summary that was used to construct this box plot is also below. What percent of the weekly salaries were between $650 and $845?
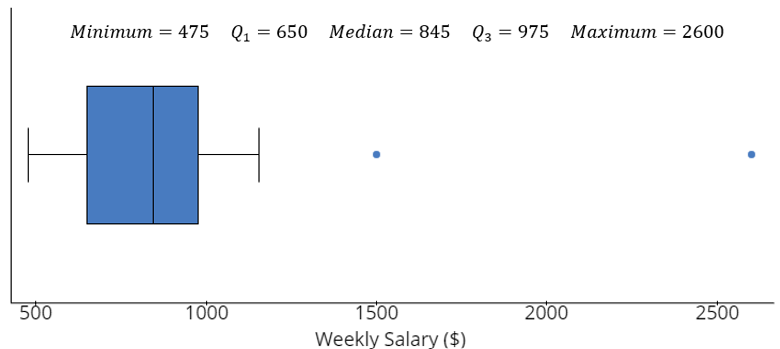


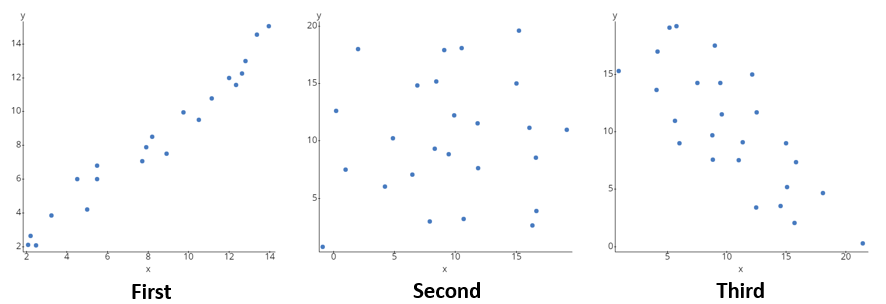
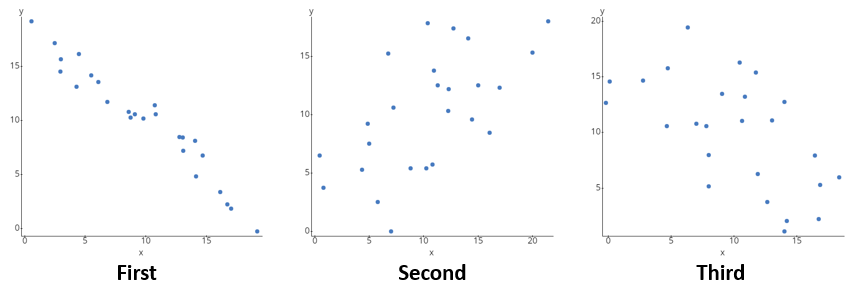
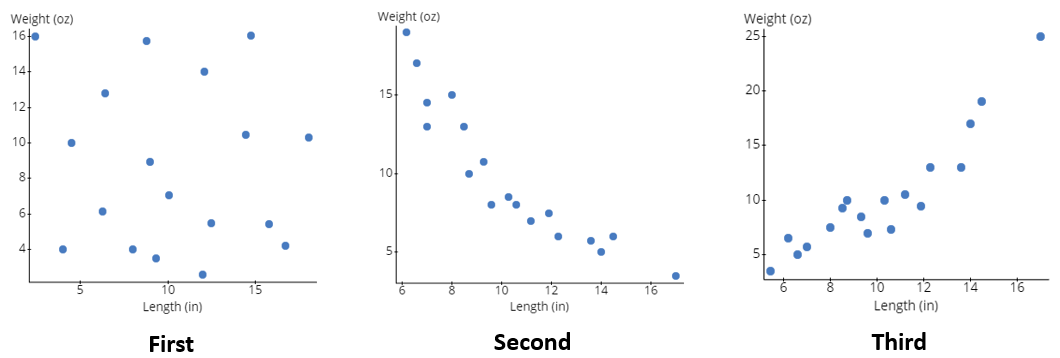
\fMinimum = 475 Q, = 650 Median = 845 Q3 =975 Maximum = 2600 500 1000 1500 2000 2500 Weekly Salary ($)Minimum = 475 Q, = 650 Median = 845 Q3 =975 Maximum = 2600 500 1000 1500 2000 2500 Weekly Salary ($)201 14 12 15 1510 10 10 10 6 5 . 10 12 14 TO O 15 X 10 15 20 First X Second Third\fweight 1on Weight (02! weight 10:) 16 a , o 14. o 12. 10- n ' 5 1o 1 5 6 a 1 o 1 2 14 16 Length {in} Length 11m Length (in! First Second Third
Step by Step Solution
There are 3 Steps involved in it

Get step-by-step solutions from verified subject matter experts