

Question: Question 3 0.4 pts In comparing three groups using ANOVA hypothesis test, the following results were obtained. Which one of the following is NOT correct?
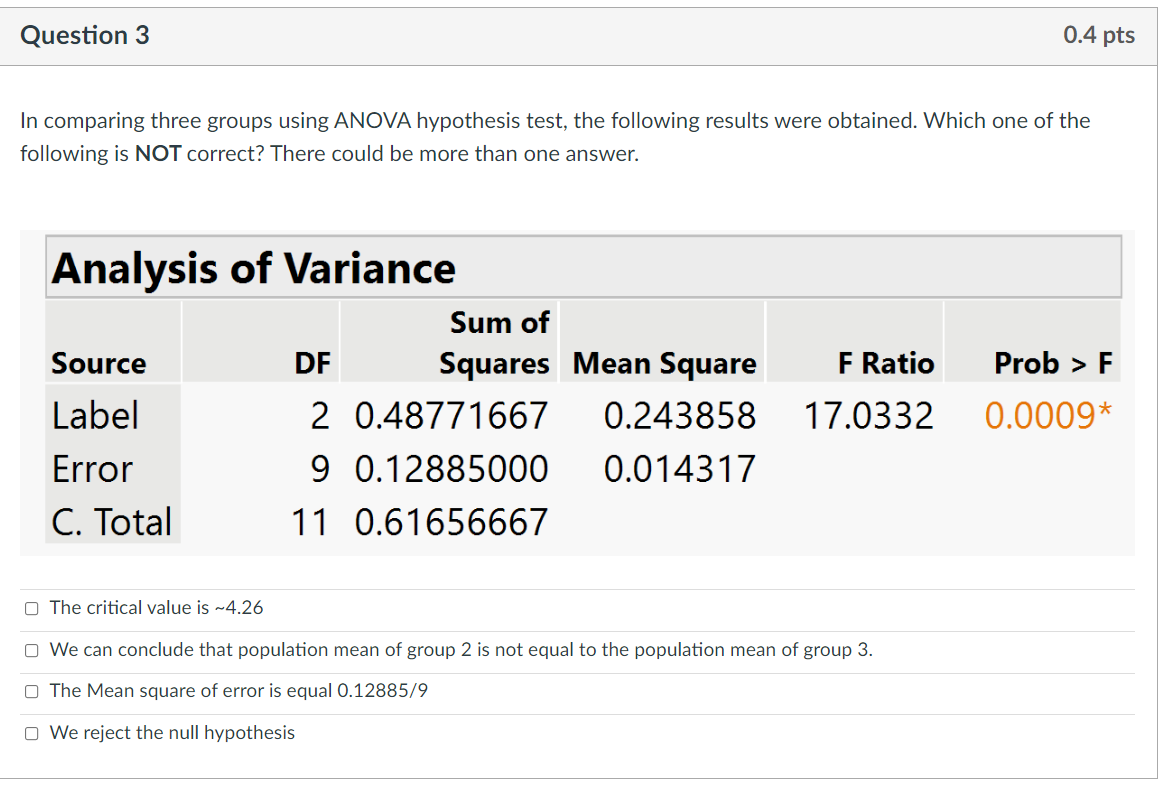
Question 3 0.4 pts In comparing three groups using ANOVA hypothesis test, the following results were obtained. Which one of the following is NOT correct? There could be more than one answer. Analysis of Variance Sum of Source DF Squares Mean Square F Ratio Prob > F Label 2 048771667 0.243858 17.0332 00009" Error 9 012885000 0.014317 C. Total 11 0.61656667 [:1 The critical value is ~4.26 [I] We can conclude that population mean of group 2 is not equal to the population mean of group 3. [I] The Mean square of error is equal 0.12885X9 [I] We reject the null hypothesis
Step by Step Solution
There are 3 Steps involved in it
1 Expert Approved Answer
Step: 1 Unlock

Question Has Been Solved by an Expert!
Get step-by-step solutions from verified subject matter experts
Step: 2 Unlock
Step: 3 Unlock