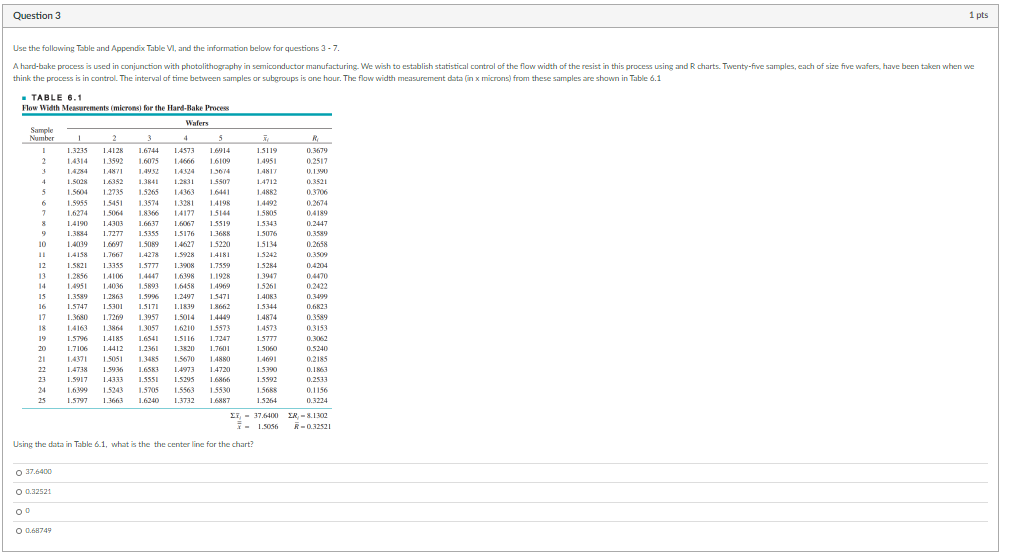
Question: Question 3 1 pts Use the following Table and Appendix Table VI, and the information below for questions 3 - 7. A hard-bake process is

Question 3 1 pts Use the following Table andQuestion 3 1 pts Use the following Table andQuestion 3 1 pts Use the following Table andQuestion 3 1 pts Use the following Table and

Question 3 1 pts Use the following Table and Appendix Table VI, and the information below for questions 3 - 7. A hard-bake process is used in conjunction with photolithography in semiconductor manufacturing. We wish to establish statistical control of the flow width of the resist in this process using and R charts. Twenty-five samples, each of size five wafers, have been taken when we think the process is in control. The interval of time between samples ar subgroups is one hour. The flow width measurement data (in x microns) from these samples are shown in Table 6.1 13592 1.1951 TABLE 6.1 Flow Width Measurements (microns) for the Hard-Bake Process Wafers Sample Number 1 2 3 4 5 RE 1.3235 1.412 1.6744 1.4575 1.6914 1.5119 0.1679 2 14314 1.607 1.4666 16109 0.2512 3 3 1.414 1.4871 1.495 1361 1.41 0.1990 4 1.500 1.6352 1.3841 1.2831 1.5507 1.4712 0.3521 5 1.5604 1.2735 1.5265 14363 16141 1.4882 0.3706 6 1.5955 1.5451 1.3574 1.5281 1.4198 0.2674 7 1.6274 1.5064 1.8.16 14122 1.5144 1.5805 0.4189 8 1.4190 1.4308 1.6637 1.6067 1.3519 1.5343 0.2447 9 1.3684 1.7277 1.3355 1.5176 1.368 15076 0.3599 10 10 1.4139 1.6697 1.5019 1.4627 1.5220 1.514 0.2658 1.4158 1.4278 1.5921 1418 1.3242 0.3509 12 1.5621 1.3155 1.5777 1.390 1.7559 0.4204 13 1.2856 14106 16398 1.1920 1.3947 0.4470 1.4951 14036 1.5893 1.6458 144969 1.5261 0.2422 15 1.350 1.2863 1.5996 1.2497 1.5471 1.4083 0.3000 16 1.5747 1.5301 1.5171 1.1839 1.8662 1.5344 0.6623 17 12 1.3680 1.7209 1.3957 1.5014 1.4449 1.4874 0.3589 18 1.4163 1.3864 1.3057 1.6210 1.5573 1.4573 19 0.3153 19 1.5796 1.4185 1.6541 1.511G 1.7247 1.5777 0.3062 20 1.7106 1.4412 1.2361 1.7601 1.50160 0.5240 1.4371 1.505 1.3485 14880 1469 0.2185 22 1.4738 1.59M 1.6583 1.4973 14720 1.5.200 0.13 1.5917 1.4333 1.5551 1.5293 1.6866 1.5592 0.2533 1.6.999 1.5243 1.5705 1.5563 1.55.30 1.5688 0.1156 1.57 1.3663 1.6240 1.3712 1.687 1.5264 0.3224 II, -37.6400 - 12 7. 1.5056 R-0.32521 13284 Using the data in Table 6.1, what is the the center line for the chart? 0 37.6400 O 0.32521 O 0.68749 o O 0.32521 02.114 O 0.61749

Step by Step Solution

There are 3 Steps involved in it

1 Expert Approved Answer
Step: 1 Unlock blur-text-image
Question Has Been Solved by an Expert!

Get step-by-step solutions from verified subject matter experts

Step: 2 Unlock
Step: 3 Unlock

Students Have Also Explored These Related General Management Questions!