

Question: QUESTION 3 11 points Save Answer In a recent survey, 170 respondents were randomly selected and asked whether they are looking forward to the premium
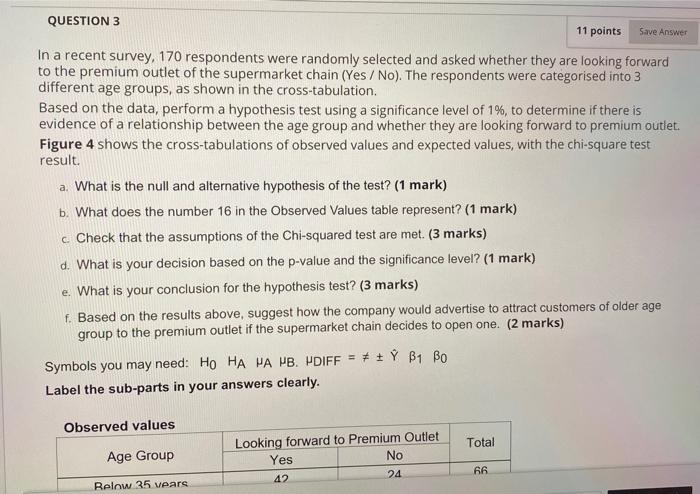
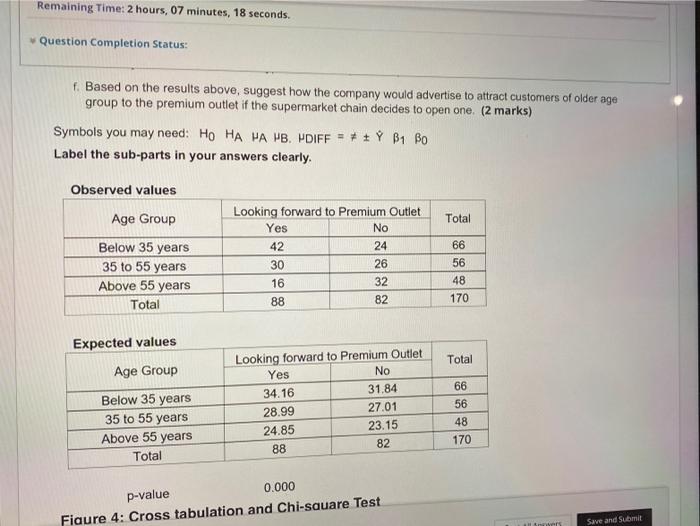
QUESTION 3 11 points Save Answer In a recent survey, 170 respondents were randomly selected and asked whether they are looking forward to the premium outlet of the supermarket chain (Yes/No). The respondents were categorised into 3 different age groups, as shown in the cross-tabulation. Based on the data, perform a hypothesis test using a significance level of 1%, to determine if there is evidence of a relationship between the age group and whether they are looking forward to premium outlet. Figure 4 shows the cross-tabulations of observed values and expected values, with the chi-square test result. a. What is the null and alternative hypothesis of the test? (1 mark) b. What does the number 16 in the Observed Values table represent? (1 mark) c Check that the assumptions of the Chi-squared test are met. (3 marks) d. What is your decision based on the p-value and the significance level? (1 mark) e. What is your conclusion for the hypothesis test? (3 marks) f. Based on the results above, suggest how the company would advertise to attract customers of older age group to the premium outlet if the supermarket chain decides to open one. (2 marks) * Y B1 Bo Symbols you may need: HO HA PA PB. PDIFF = Label the sub-parts in your answers clearly. Observed values Total Age Group Looking forward to Premium Outlet Yes No 42 24 66 Relow 35 vears Remaining Time: 2 hours, 07 minutes, 18 seconds. Question Completion Status: f. Based on the results above, suggest how the company would advertise to attract customers of older age group to the premium outlet if the supermarket chain decides to open one. (2 marks) Symbols you may need: HO HA HA HB. PDIFF = # B1 Bo Label the sub-parts in your answers clearly. Observed values Looking forward to Premium Outlet Age Group Total Yes 42 30 Below 35 years 35 to 55 years Above 55 years Total No 24 26 32 82 66 56 48 170 16 88 Expected values Total Age Group Below 35 years 35 to 55 years Above 55 years Total Looking forward to Premium Outlet Yes No 34.16 31.84 28.99 27.01 24.85 23.15 88 82 66 56 48 170 p-value 0.000 Fiaure 4: Cross tabulation and Chi-square Test Save and Submit
Step by Step Solution
There are 3 Steps involved in it

Get step-by-step solutions from verified subject matter experts