

Question: Question 3 2 pts Calculate the average runs scored by a baseball team during the season given the data below: April Average Runs 4.1
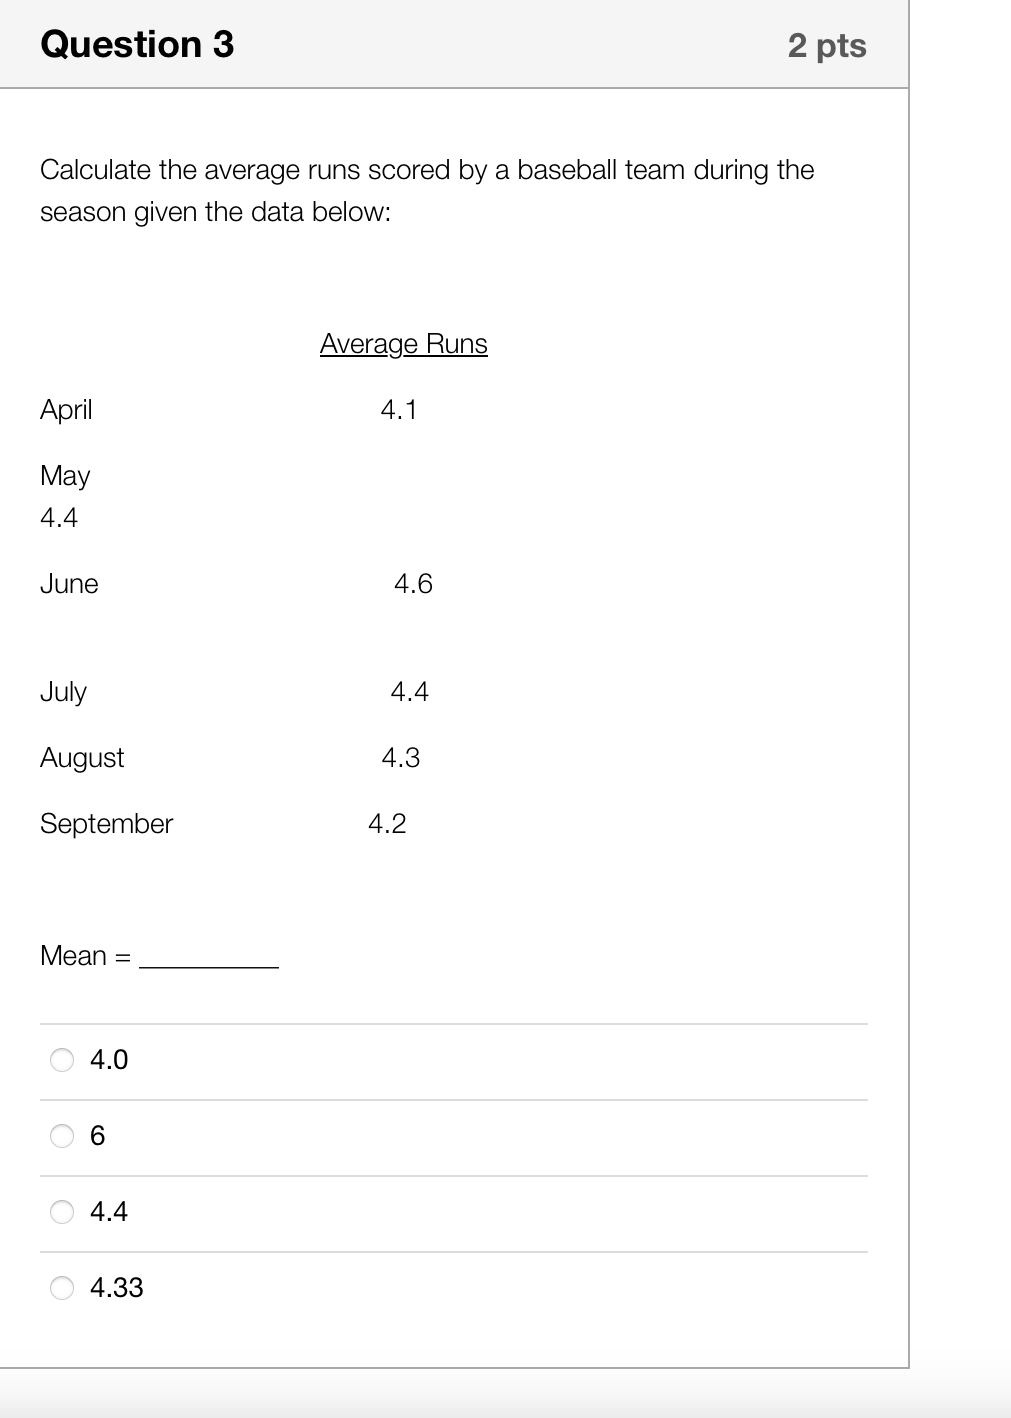
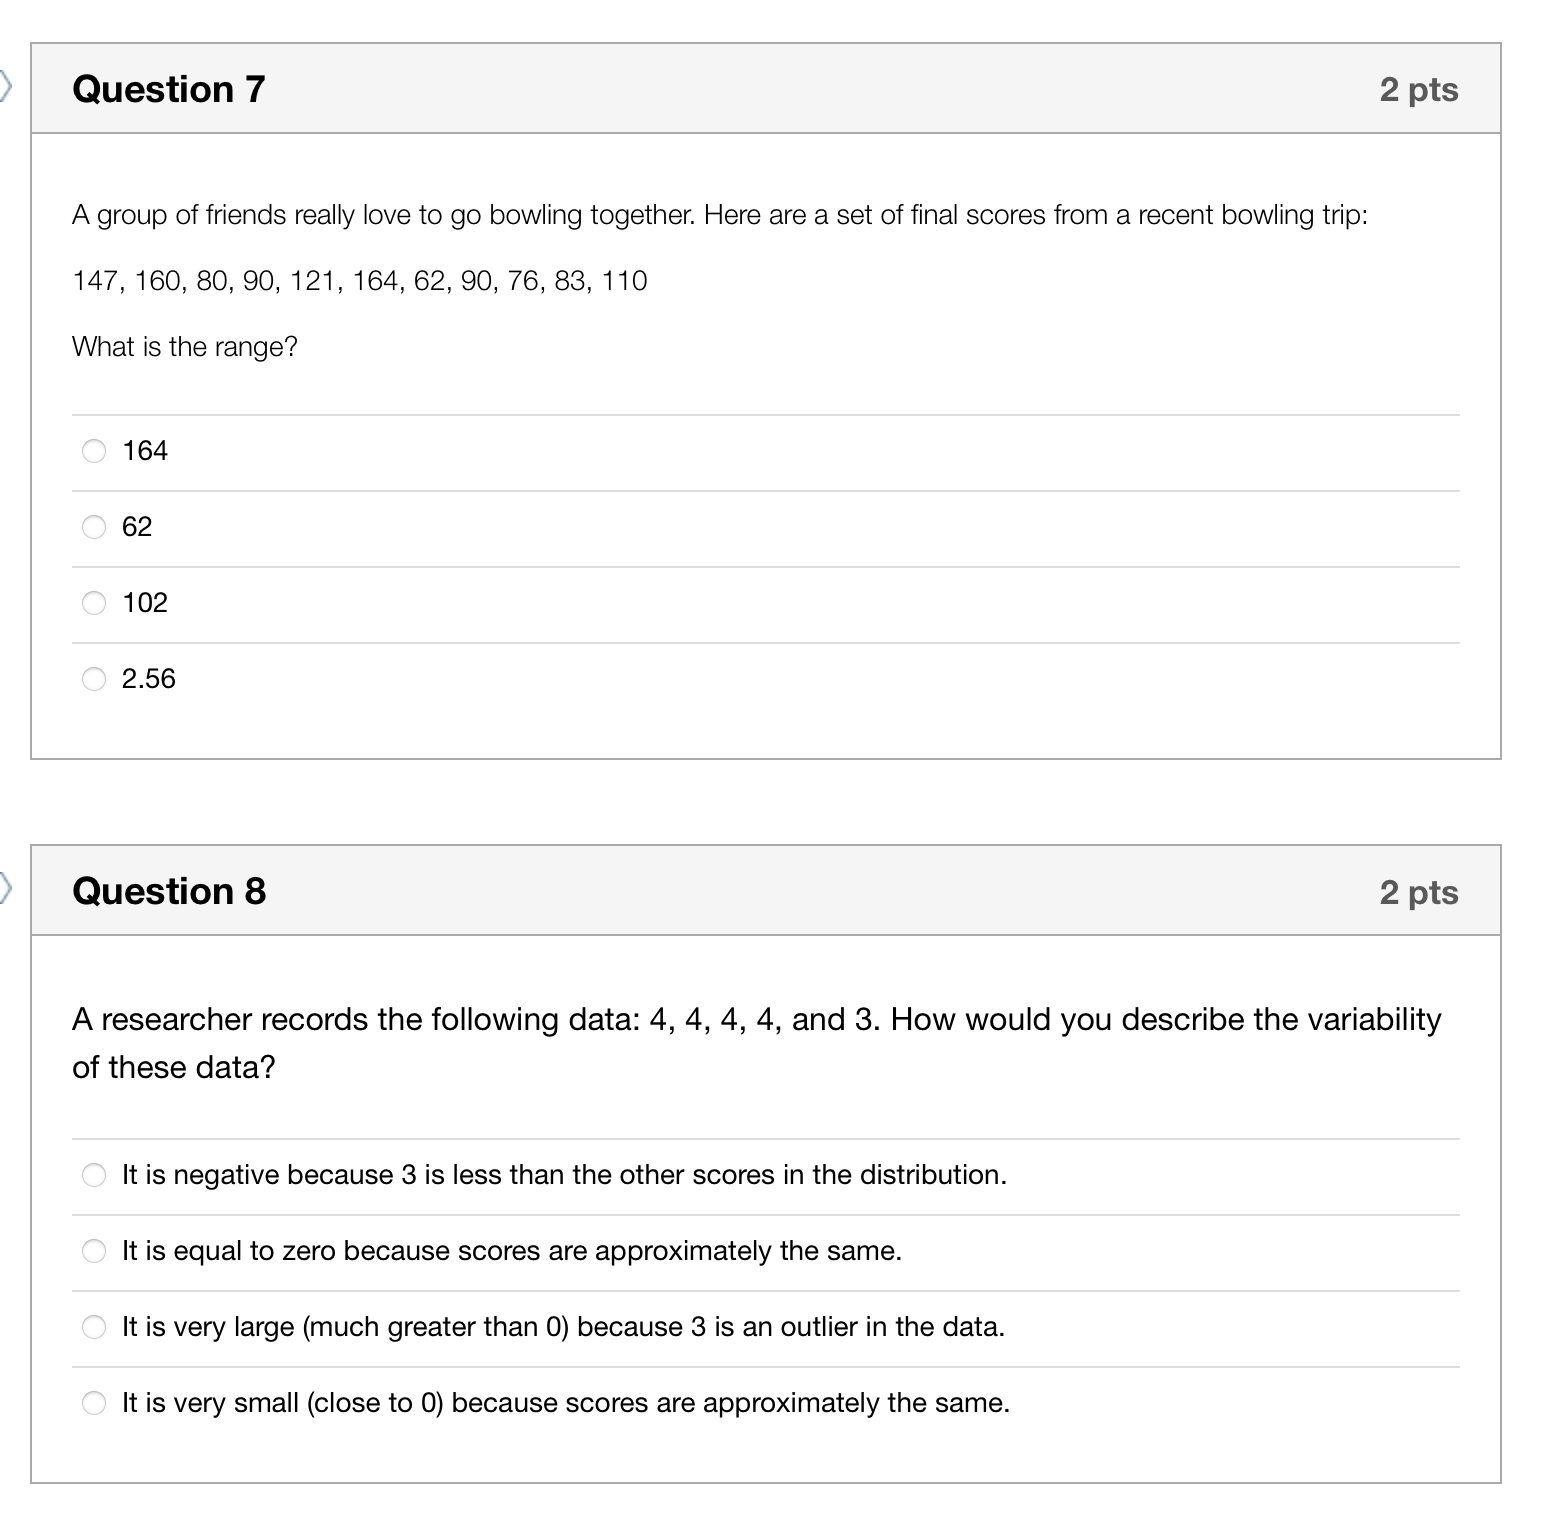
Question 3 2 pts Calculate the average runs scored by a baseball team during the season given the data below: April Average Runs 4.1 May 4.4 June 4.6 July 4.4 August 4.3 September 4.2 Mean = 4.0 6 4.4 4.33 Question 7 A group of friends really love to go bowling together. Here are a set of final scores from a recent bowling trip: 147, 160, 80, 90, 121, 164, 62, 90, 76, 83, 110 What is the range? 164 62 102 2.56 Question 8 2 pts 2 pts A researcher records the following data: 4, 4, 4, 4, and 3. How would you describe the variability of these data? It is negative because 3 is less than the other scores in the distribution. It is equal to zero because scores are approximately the same. It is very large (much greater than 0) because 3 is an outlier in the data. It is very small (close to 0) because scores are approximately the same.
Step by Step Solution
There are 3 Steps involved in it

Get step-by-step solutions from verified subject matter experts