

Question: Question 3 2 pts Problem 2: PED and Total Revenue (10 points) We're going to use the demand curve below to evaluate the relationship between


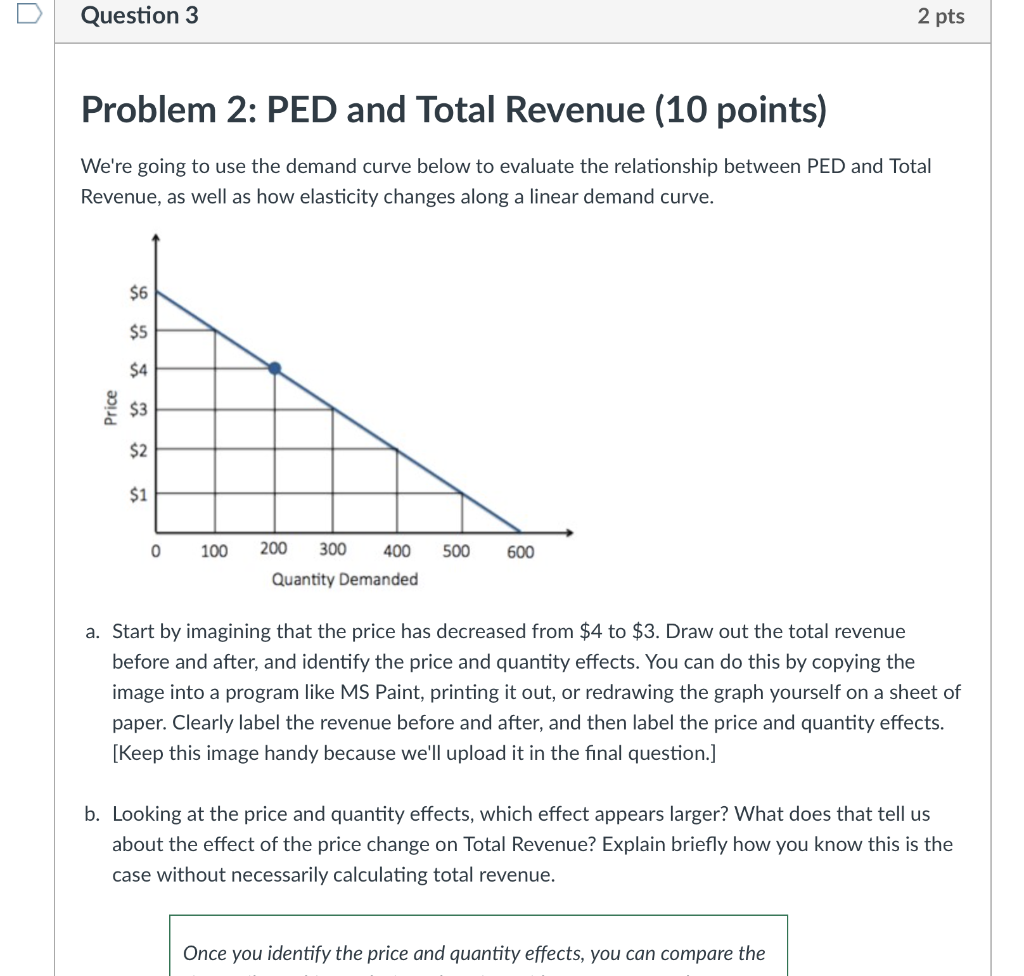
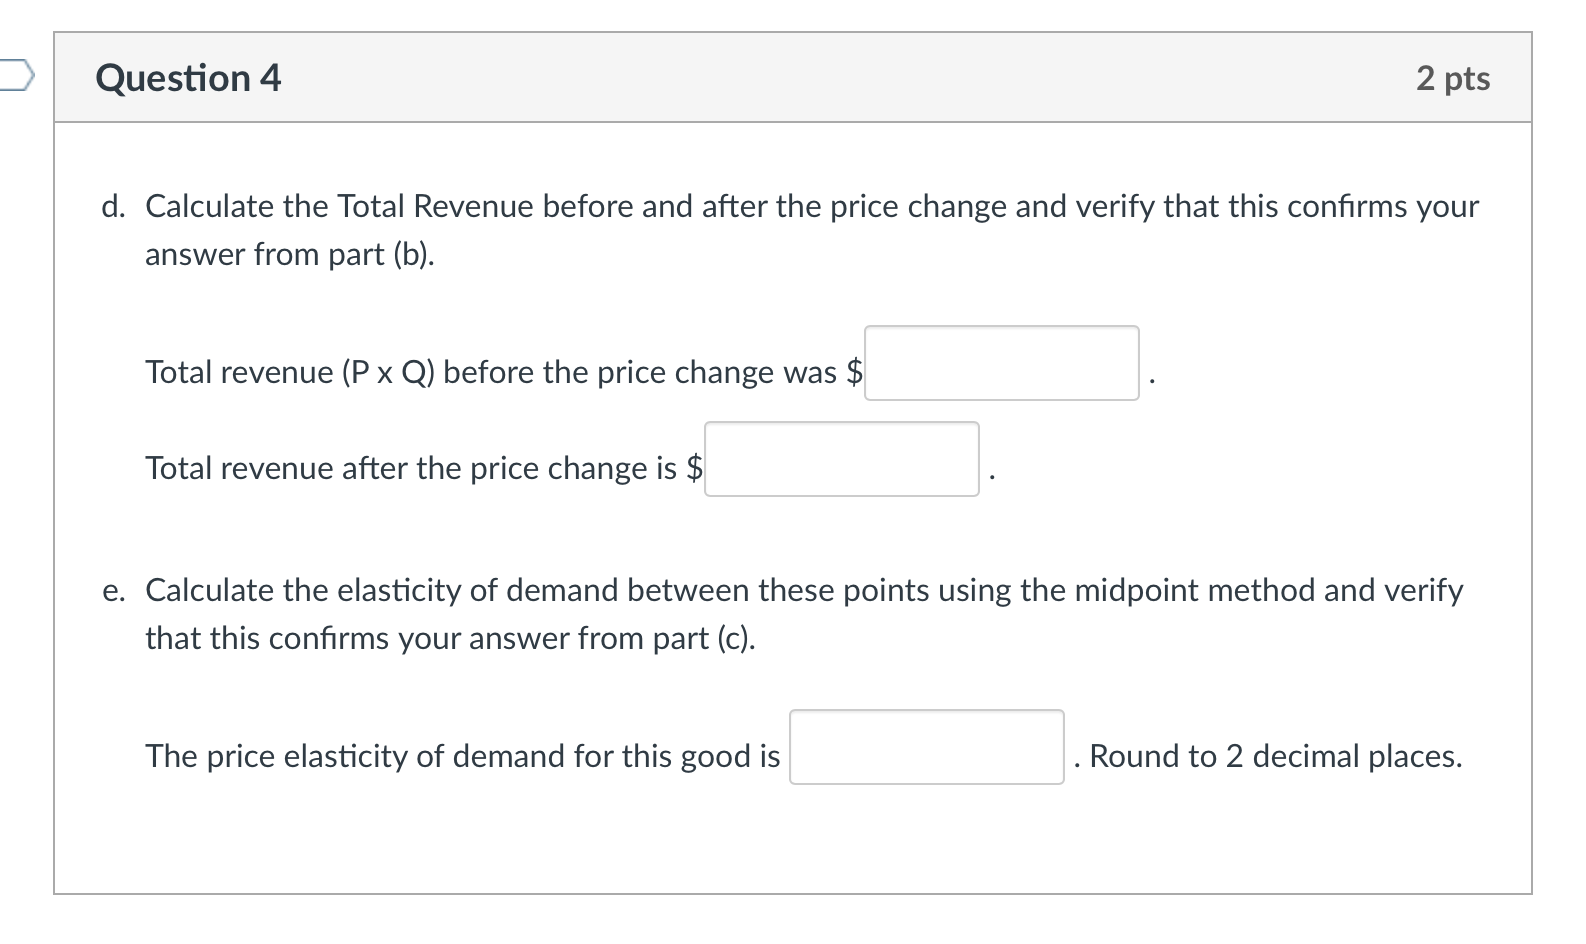
Question 3 2 pts Problem 2: PED and Total Revenue (10 points) We're going to use the demand curve below to evaluate the relationship between PED and Total Revenue, as well as how elasticity changes along a linear demand curve. Prioe Quantity Demanded a. Start by imagining that the price has decreased from $4 to $3. Draw out the total revenue before and after, and identify the price and quantity effects. You can do this by copying the image into a program like MS Paint, printing it out, or redrawing the graph yourself on a sheet of paper. Clearly label the revenue before and after, and then label the price and quantity effects. [Keep this image handy because we'll upload it in the nal question] b. Looking at the price and quantity effects, which effect appears larger? What does that tell us about the effect of the price change on Total Revenue? Explain briefly how you know this is the case without necessarily calculating total revenue. Once you identify the price and quantity effects, you can compare the Question 4 2 pts d. Calculate the Total Revenue before and after the price change and verify that this conrms your answer from part (b). Total revenue (P x Q) before the price change was $ Total revenue after the price change is $ . Calculate the elasticity of demand between these points using the midpoint method and verify that this conrms your answer from part (c). The price elasticity of demand for this good is . Round to 2 decimal places
Step by Step Solution
There are 3 Steps involved in it

Get step-by-step solutions from verified subject matter experts