

Question: Question 3 (20 marks) (a). The following table shows trends in the composition of employees of the computer Technology Company over the 8 year
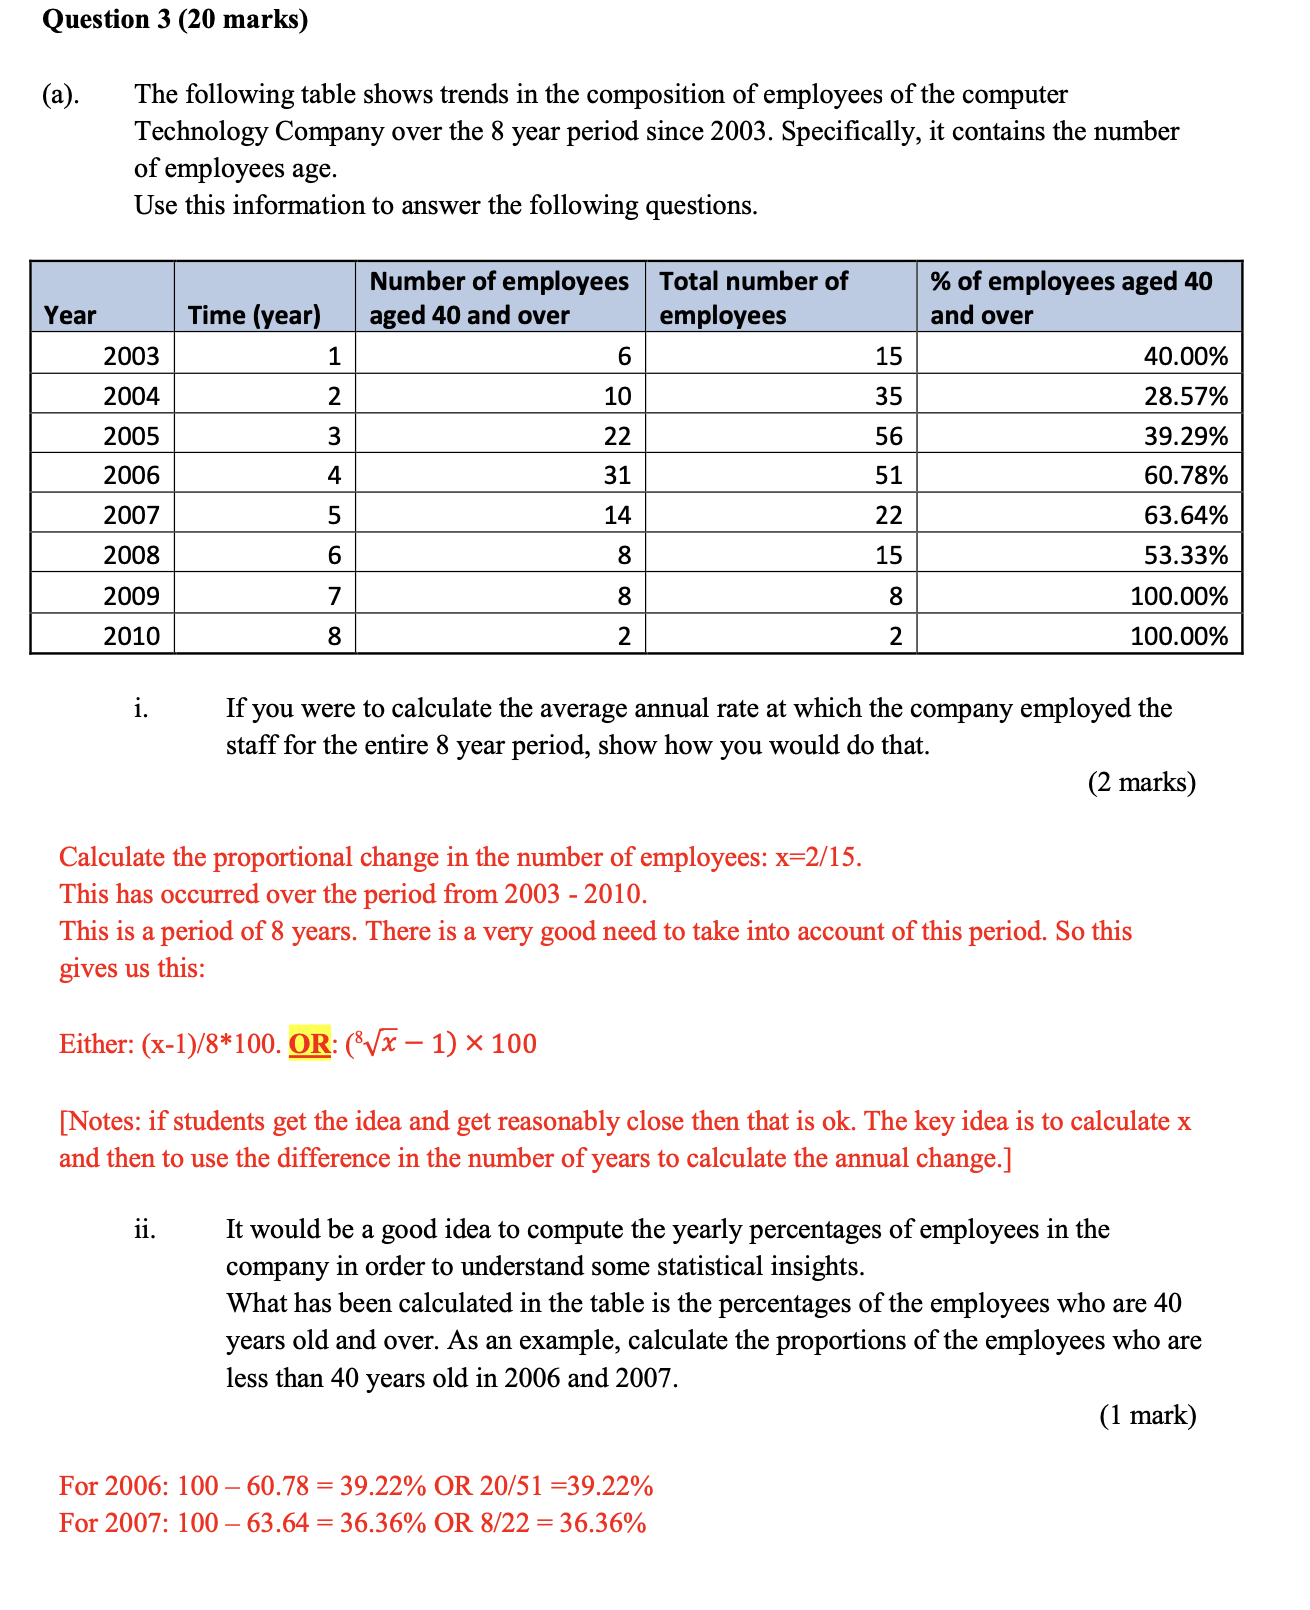
Question 3 (20 marks) (a). The following table shows trends in the composition of employees of the computer Technology Company over the 8 year period since 2003. Specifically, it contains the number of employees age. Use this information to answer the following questions. Number of employees Total number of Year Time (year) aged 40 and over employees % of employees aged 40 and over 2003 1 6 15 40.00% 2004 2 10 35 28.57% 2005 3 22 56 39.29% 2006 4 31 51 60.78% 2007 5 14 22 63.64% 2008 6 8 15 53.33% 2009 7 8 8 100.00% 2010 8 2 2 100.00% i. If you were to calculate the average annual rate at which the company employed the staff for the entire 8 year period, show how you would do that. (2 marks) Calculate the proportional change in the number of employees: x=2/15. This has occurred over the period from 2003 - 2010. This is a period of 8 years. There is a very good need to take into account of this period. So this gives us this: Either: (x-1)/8*100. OR: (8x 1) 100 [Notes: if students get the idea and get reasonably close then that is ok. The key idea is to calculate x and then to use the difference in the number of years to calculate the annual change.] ii. It would be a good idea to compute the yearly percentages of employees in the company in order to understand some statistical insights. What has been calculated in the table is the percentages of the employees who are 40 years old and over. As an example, calculate the proportions of the employees who are less than 40 years old in 2006 and 2007. For 2006: 100-60.78 = 39.22% OR 20/51 =39.22% For 2007: 100-63.64 = 36.36% OR 8/22 = 36.36% (1 mark)
Step by Step Solution
There are 3 Steps involved in it

Get step-by-step solutions from verified subject matter experts