

Question: . Question 3 (20 marks) Consider monthly demand for the ABC Corporation as shown in Table 2. Forecast the monthly demand for year 6 using
 .
.
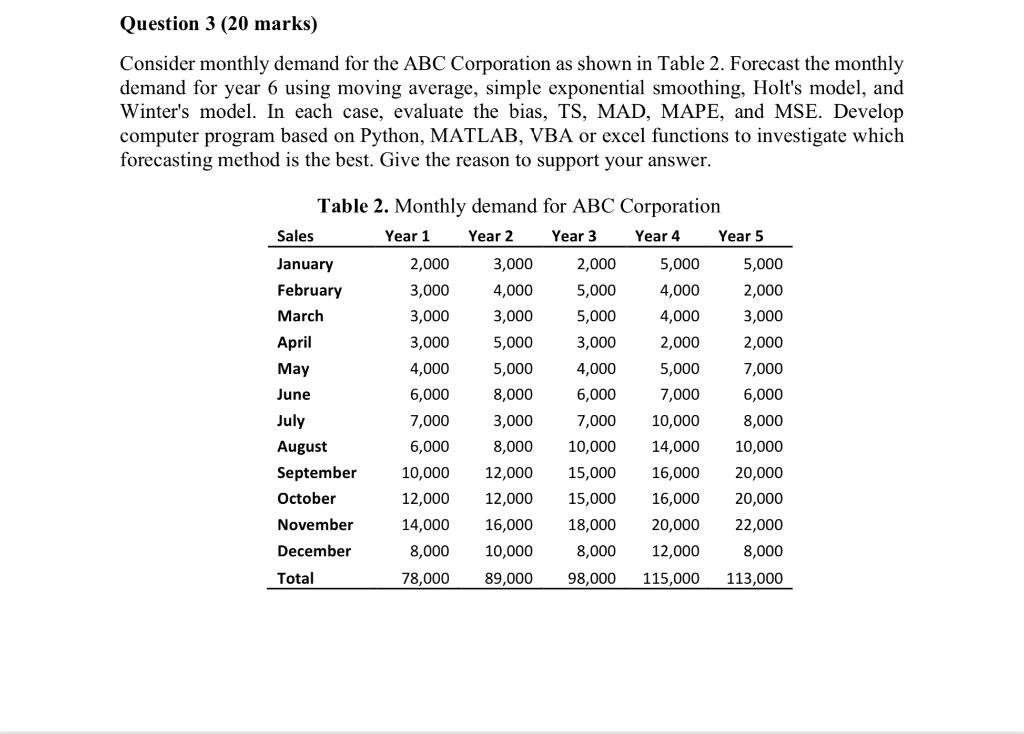
Question 3 (20 marks) Consider monthly demand for the ABC Corporation as shown in Table 2. Forecast the monthly demand for year 6 using moving average, simple exponential smoothing, Holt's model, and Winter's model. In each case, evaluate the bias, TS, MAD, MAPE, and MSE. Develop computer program based on Python, MATLAB, VBA or excel functions to investigate which forecasting method is the best. Give the reason to support your answer. Table 2. Monthly demand for ABC Corporation Sales Year 1 Year 2 Year 3 Year 4 Year 5 January 2,000 3,000 2,000 5,000 5,000 February 3,000 4,000 5,000 4,000 2,000 March 3,000 3,000 5,000 4,000 3,000 April 3,000 5,000 3,000 2,000 2,000 May 4,000 5,000 4,000 5,000 7,000 June 6,000 8,000 6,000 7,000 6,000 July 7,000 3,000 7,000 10,000 8,000 August 6,000 8,000 10,000 14,000 10,000 September 10,000 12,000 15,000 16,000 20,000 October 12,000 12,000 15,000 16,000 20,000 November 14,000 16,000 18,000 20,000 22,000 December 8,000 10,000 8,000 12,000 8,000 Total 78,000 89,000 98,000 115,000 113,000
Step by Step Solution
There are 3 Steps involved in it

Get step-by-step solutions from verified subject matter experts