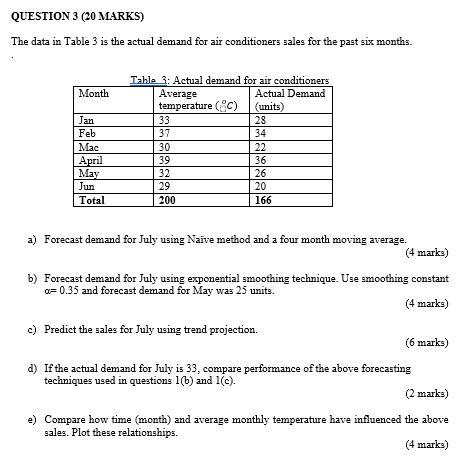
Question: QUESTION 3 (20 MARKS) The data in Table 3 is the actual demand for air conditioners sales for the past six months. Month | Jan

QUESTION 3 (20 MARKS) The data in Table 3 is the

QUESTION 3 (20 MARKS) The data in Table 3 is the actual demand for air conditioners sales for the past six months. Month | Jan Feb Mac April May Jun Total Table 3: Actual demand for air conditioners Average Actual Demand temperature (0) (units) 33 28 37 34 30 22 39 36 32 26 29 20 200 166 [ | a) Forecast demand for July using Naive method and a four month moving average. (4 marks) b) Forecast demand for July using exponential smoothing technique. Use smoothing constant a=0.35 and forecast demand for May was 25 units. (4 marks) c) Predict the sales for July using trend projection. (6 marks) d) If the actual demand for July is 33, compare performance of the above forecasting techniques used in questions 1(b) and 1(c). (2 marks) Compare how time (month) and average monthly temperature have influenced the above sales. Plot these relationships. (4 marks)

Step by Step Solution

There are 3 Steps involved in it

1 Expert Approved Answer
Step: 1 Unlock blur-text-image
Question Has Been Solved by an Expert!

Get step-by-step solutions from verified subject matter experts

Step: 2 Unlock
Step: 3 Unlock

Students Have Also Explored These Related General Management Questions!