

Question: Question 3 (20 points) The table below shows the two-dimensional frequency distribution of a sample of 80 persons in a study about the relation between
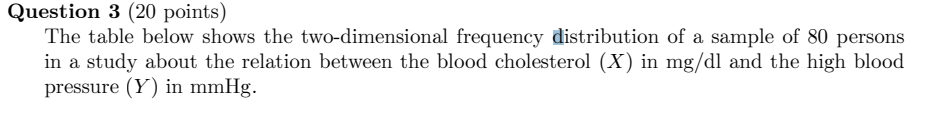
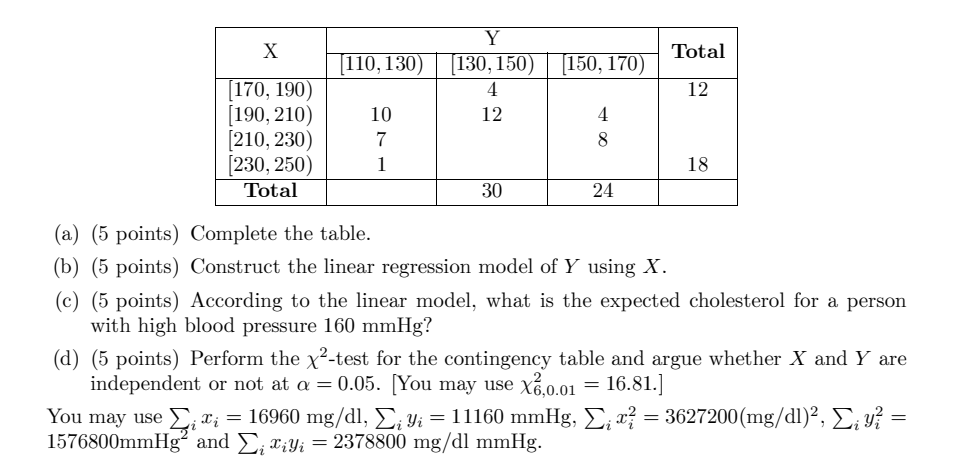
Question 3 (20 points) The table below shows the two-dimensional frequency distribution of a sample of 80 persons in a study about the relation between the blood cholesterol (X ) in mg/dl and the high blood pressure (Y ) in mmlg.Y X Total 110, 130 130, 150) 150, 170) 170, 190) 4 12 190, 210) 10 12 OO A 210, 230) 7 (230, 250) 18 Total 30 24 (a) (5 points) Complete the table. (b) (5 points) Construct the linear regression model of Y using X. (c) (5 points) According to the linear model, what is the expected cholesterol for a person with high blood pressure 160 mmHg? (d) (5 points) Perform the x'-test for the contingency table and argue whether X and Y are independent or not at a = 0.05. [You may use X6,0.01 = 16.81.] You may use _, x; = 16960 mg/dl, _ y; = 11160 mmHg, _, x? = 3627200(mg/dl)2, C y? = 1576800mmHg and C. my; = 2378800 mg/dl mmHg
Step by Step Solution
There are 3 Steps involved in it

Get step-by-step solutions from verified subject matter experts