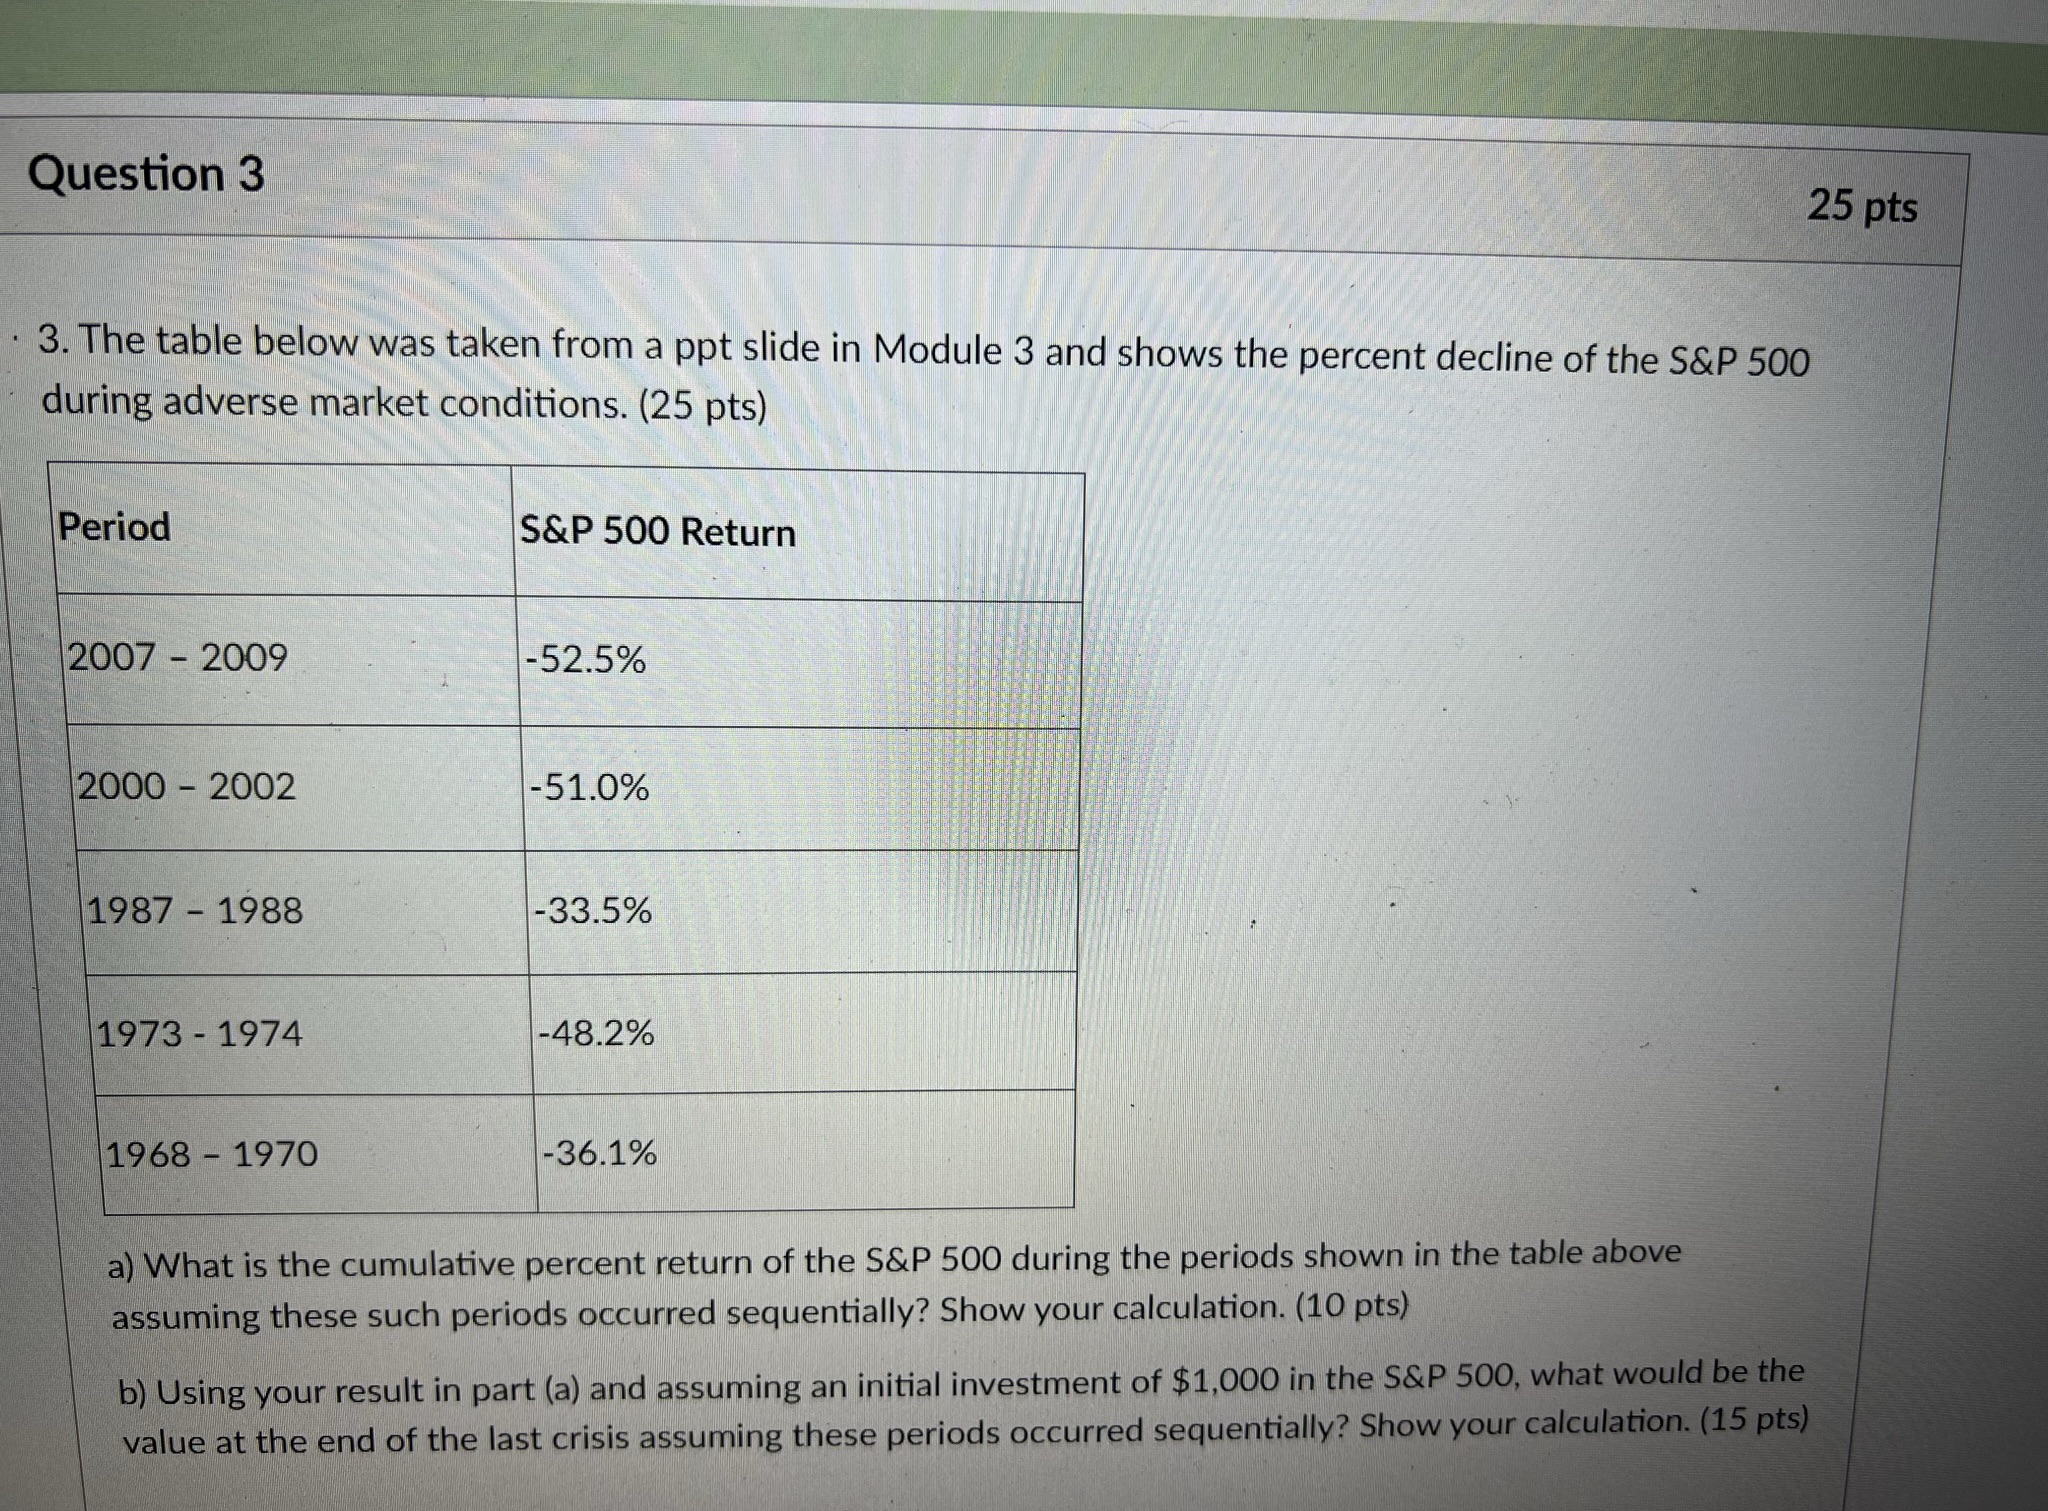
Question: Question 3 25 pts 3. The table below was taken from a ppt slide in Module 3 and shows the percent decline of the S&P

Question 3 25 pts 3. The table below was taken
Question 3 25 pts 3. The table below was taken from a ppt slide in Module 3 and shows the percent decline of the S&P 500 during adverse market conditions. (25 pts) Period S&P 500 Return 2007 - 2009 -52.5% 2000 - 2002 -51.0% 1987 - 1988 -33.5% 1973 - 1974 -48.2% 1968 - 1970 -36.1% a) What is the cumulative percent return of the S&P 500 during the periods shown in the table above assuming these such periods occurred sequentially? Show your calculation. (10 pts) b) Using your result in part (a) and assuming an initial investment of $1,000 in the S&P 500, what would be the value at the end of the last crisis assuming these periods occurred sequentially? Show your calculation. (15 pts)

Step by Step Solution

There are 3 Steps involved in it

1 Expert Approved Answer
Step: 1 Unlock blur-text-image
Question Has Been Solved by an Expert!

Get step-by-step solutions from verified subject matter experts

Step: 2 Unlock
Step: 3 Unlock

Students Have Also Explored These Related Finance Questions!