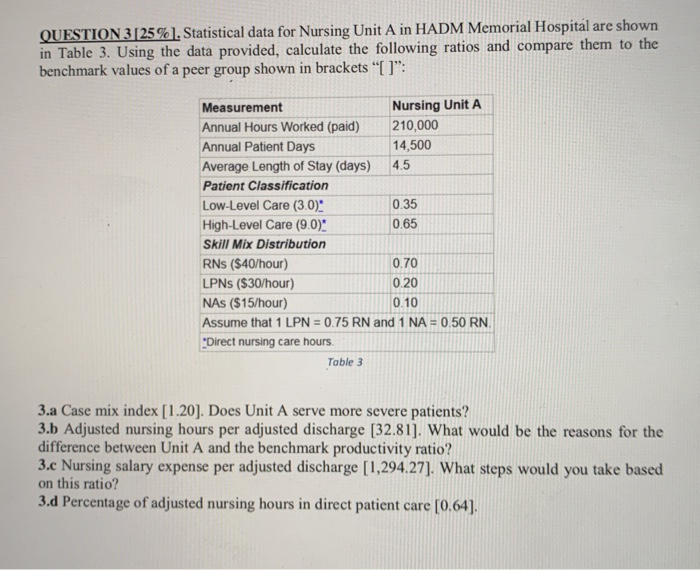
Question: QUESTION 3 [25%). Statistical data for Nursing Unit A in HADM Memorial Hospital are shown in Table 3. Using the data provided, calculate the following

QUESTION 3 [25%). Statistical data for Nursing
QUESTION 3 [25%). Statistical data for Nursing Unit A in HADM Memorial Hospital are shown in Table 3. Using the data provided, calculate the following ratios and compare them to the benchmark values of a peer group shown in brackets "[]": Measurement Nursing Unit A Annual Hours Worked (paid) 210,000 Annual Patient Days 14,500 Average Length of Stay (days) 4.5 Patient Classification Low-Level Care (3.0) 0.35 High-Level Care (9.0)" 0.65 Skill Mix Distribution RNS ($40/hour) 0.70 LPNs ($30/hour) 0.20 NAs ($15/hour) 0.10 Assume that 1 LPN = 0.75 RN and 1 NA = 0.50 RN. "Direct nursing care hours. Table 3 3.a Case mix index [1.20]. Does Unit A serve more severe patients? 3.b Adjusted nursing hours per adjusted discharge (32.81). What would be the reasons for the difference between Unit A and the benchmark productivity ratio? 3.c Nursing salary expense per adjusted discharge [1,294.27]. What steps would you take based on this ratio? 3.d Percentage of adjusted nursing hours in direct patient care (0.64]

Step by Step Solution

There are 3 Steps involved in it

1 Expert Approved Answer
Step: 1 Unlock blur-text-image
Question Has Been Solved by an Expert!

Get step-by-step solutions from verified subject matter experts

Step: 2 Unlock
Step: 3 Unlock

Students Have Also Explored These Related General Management Questions!