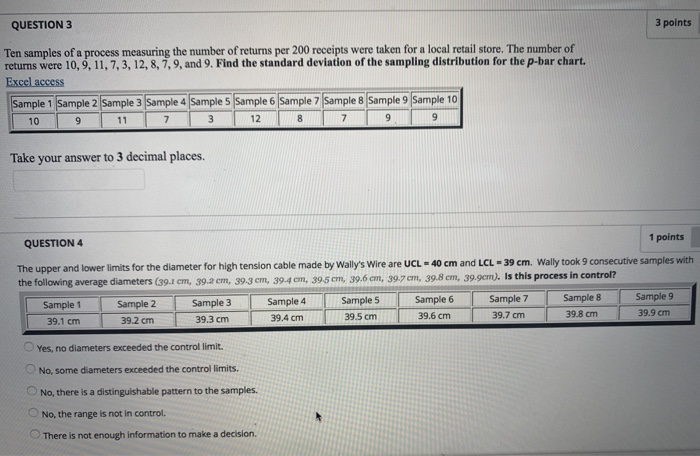
Question: QUESTION 3 3 points Ten samples of a process measuring the number of returns per 200 receipts were taken for a local retail store. The

QUESTION 3 3 points Ten samples of a process
QUESTION 3 3 points Ten samples of a process measuring the number of returns per 200 receipts were taken for a local retail store. The number of returns were 10, 9, 11, 7, 3, 12, 8, 7, 9, and 9. Find the standard deviation of the sampling distribution for the p-bar chart. Excel access Sample 1 Sample 2 Sample 3 Sample 4 Sample 5 Sample 6 Sample 7 Sample 8 Sample 9 Sample 10 109 11 312 8199 Take your answer to 3 decimal places. QUESTION 4 1 points The upper and lower limits for the diameter for high tension cable made by Wally's Wire are UCL = 40 cm and LCL - 39 cm. Wally took 9 consecutive samples with the following average diameters (39.1 cm, 39.2 cm, 393 cm, 39.4 cm, 39,5 cm, 39.6 cm, 39.7 cm, 39.8 cm, 39.9cm). Is this process in control? Sample 1 Sample 2 Sample 3 Sample 4 Sample 5 Sample 6 Sample 7 Sample 8 Sample 9 39.1 cm 39.2 cm 39.3 cm 39.4 cm 3 9.5 cm 39.6 cm 39.7 cm 39.8 cm 39.9 cm Yes, no diameters exceeded the controllimit No, some diameters exceeded the controllimits. No, there is a distinguishable pattern to the samples. No, the range is not in control. There is not enough information to make a decision

Step by Step Solution

There are 3 Steps involved in it

1 Expert Approved Answer
Step: 1 Unlock blur-text-image
Question Has Been Solved by an Expert!

Get step-by-step solutions from verified subject matter experts

Step: 2 Unlock
Step: 3 Unlock

Students Have Also Explored These Related General Management Questions!