

Question: Question 3 (30 points): Use the production information from Question 2. 3.1 Draw the aggregate supply curve for strawberries in Figure 3a and for soybeans
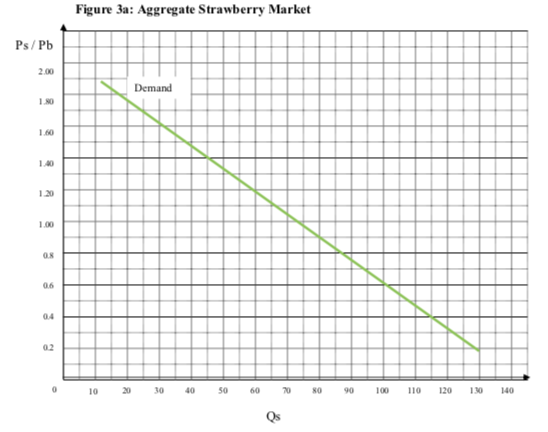
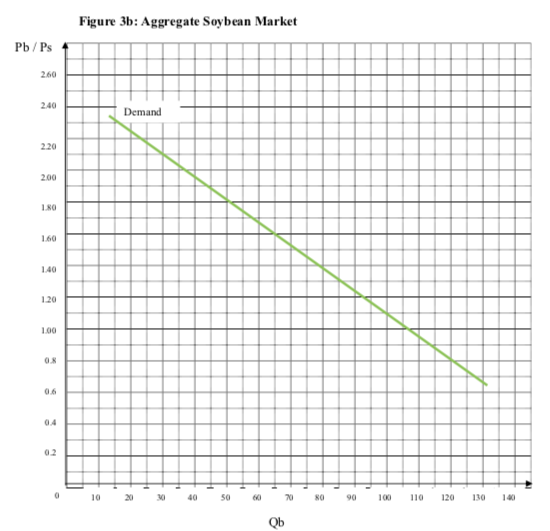
Question 3 (30 points): Use the production information from Question 2. 3.1 Draw the aggregate supply curve for strawberries in Figure 3a and for soybeans in Figure 3b (5 points) 3.2 Given the aggregate demand curves for strawberries and soybeans drawn in those figures, what are the equilibrium price ratios for strawberries and soybeans (5 points)? Ps/Pb- Pb/Ps- 3.3 Now suppose that demand curves for each of the two goods shifts and the new world equilibrium price is Ps/Pb = 1. On Figures 3a and 3b, show how the demand curves for strawberries and soybeans should be shifted so that this new price ratio represents an equilibrium price ratio (5 points). 3.4 Is this price a feasible trade price? Explain why (5 points). 3.5 How will this new world price affect the consumption possibility frontiers of the US and Mexico? Explain why (5 points). 3.6 How will the gains from trade of the two countries be affected by this change in the relative price ratio? Explain why (5 points). Figure 3a: Aggregate Strawberry Market Ps/Pb 2.00 Demand 1.NO 1.60 1.00 1.20 1.00 NO 0.6 04 02 10 20 30 40 50 09 70 NO 90 100 110 120 130 140 Figure 3b: Aggregate Soybean Market Pb/Ps 260 240 Demand 2.20 200 1.NO 1 40 1.20 1.00 06 02 a 10 201 V 40 Sa ca 70 Na 90 100 110 120 130 140 Ob Question 3 (30 points): Use the production information from Question 2. 3.1 Draw the aggregate supply curve for strawberries in Figure 3a and for soybeans in Figure 3b (5 points) 3.2 Given the aggregate demand curves for strawberries and soybeans drawn in those figures, what are the equilibrium price ratios for strawberries and soybeans (5 points)? Ps/Pb- Pb/Ps- 3.3 Now suppose that demand curves for each of the two goods shifts and the new world equilibrium price is Ps/Pb = 1. On Figures 3a and 3b, show how the demand curves for strawberries and soybeans should be shifted so that this new price ratio represents an equilibrium price ratio (5 points). 3.4 Is this price a feasible trade price? Explain why (5 points). 3.5 How will this new world price affect the consumption possibility frontiers of the US and Mexico? Explain why (5 points). 3.6 How will the gains from trade of the two countries be affected by this change in the relative price ratio? Explain why (5 points). Figure 3a: Aggregate Strawberry Market Ps/Pb 2.00 Demand 1.NO 1.60 1.00 1.20 1.00 NO 0.6 04 02 10 20 30 40 50 09 70 NO 90 100 110 120 130 140 Figure 3b: Aggregate Soybean Market Pb/Ps 260 240 Demand 2.20 200 1.NO 1 40 1.20 1.00 06 02 a 10 201 V 40 Sa ca 70 Na 90 100 110 120 130 140 Ob
Step by Step Solution
There are 3 Steps involved in it

Get step-by-step solutions from verified subject matter experts