

Question: Question 3 4 Marks The Table below is taken from the Australian Bureau of Statistics (ABS) website. It provides data on Australian households with internet
Question 3 4 Marks The Table below is taken from the Australian Bureau of Statistics (ABS) website. It provides data on Australian households with internet access at home from the Household Use of Information Technology Survey. From the information provided in the table above, (a) What is the probability that a randomly selected household lives in Western Australia? 1 mark (b) What is the probability that a randomly selected household has an internet access in 2014-15 or 2016-17? 1 mark (c) What is the probability that a randomly selected household lives in Queensland and has an internet access in the year 2008-09? 1 mark (d) Given that a household has an internet access in 2010-11, what is the probability that a randomly selected household lives in Tasmania? 1 mark
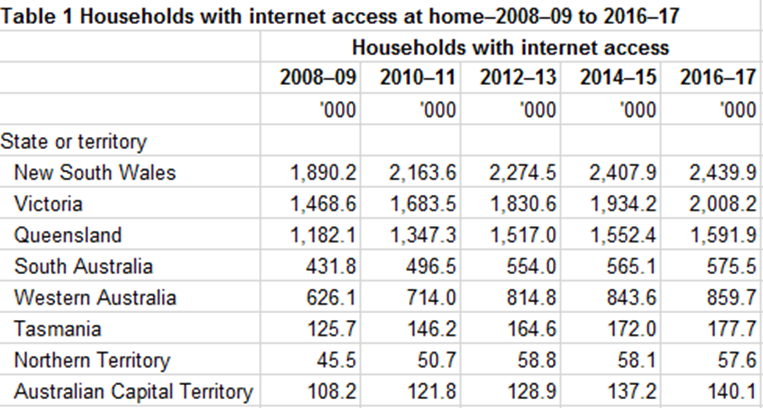
Table 1 Households with internet access at home-2008-09 to 2016-17 Households with internet access 2008-09 2010-11 2012-13 2014-15 2016-17 '000 '000 '000 '000 '000 State or territory New South Wales 1,890.2 2, 163.6 2,274.5 2,407.9 2,439.9 Victoria 1,468.6 1,683.5 1,830.6 1,934.2 2,008.2 Queensland 1, 182.1 1,347.3 1,517.0 1,552.4 1,591.9 South Australia 431.8 496.5 554.0 565.1 575.5 Western Australia 626.1 714.0 814.8 843.6 859.7 Tasmania 125.7 146.2 164.6 172.0 177.7 Northern Territory 45.5 50.7 58.8 58.1 57.6 Australian Capital Territory 108.2 121.8 128.9 137.2 140.1
Step by Step Solution
There are 3 Steps involved in it

Get step-by-step solutions from verified subject matter experts