

Question: Question 3 5 pts The ANOVA table below shows the results of a study that compares the mean numbers of good friends, for three levels
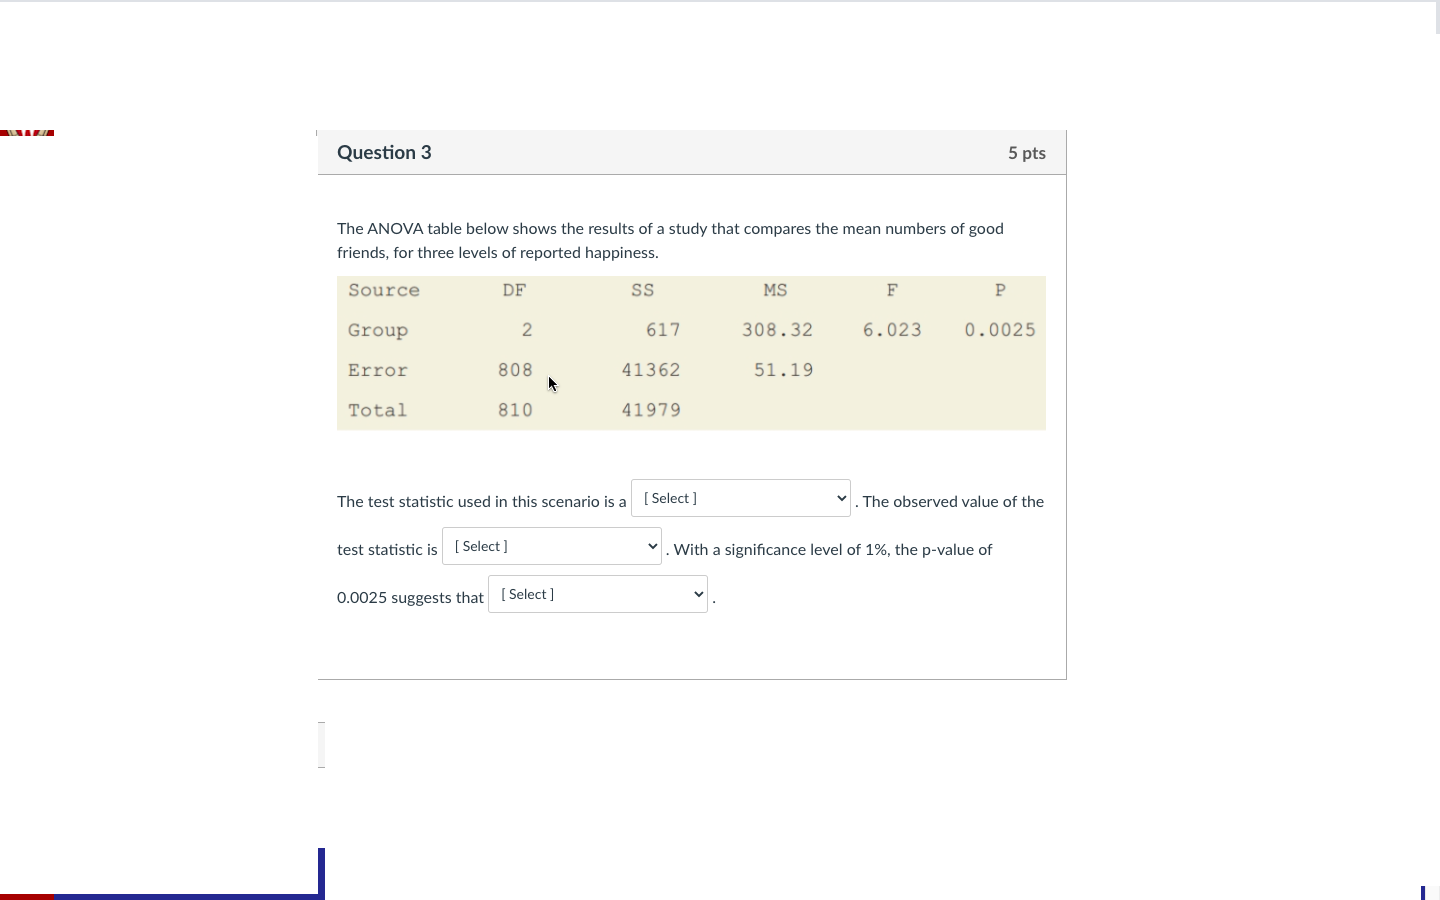
Question 3 5 pts The ANOVA table below shows the results of a study that compares the mean numbers of good friends, for three levels of reported happiness. Source DF SS MS F P Group 2 617 308.32 6. 023 0 . 0025 Error 808 41362 51 . 19 Total 810 41979 The test statistic used in this scenario is a [ Select ] v . The observed value of the test statistic is [ Select ] . With a significance level of 1%, the p-value of 0.0025 suggests that [ Select ]
Step by Step Solution
There are 3 Steps involved in it
1 Expert Approved Answer
Step: 1 Unlock

Question Has Been Solved by an Expert!
Get step-by-step solutions from verified subject matter experts
Step: 2 Unlock
Step: 3 Unlock