

Question: Question 3 6 I have created a relationship between two tables, Employee and Payroll. There are 5 employees in this dataset. One employee can be
Question
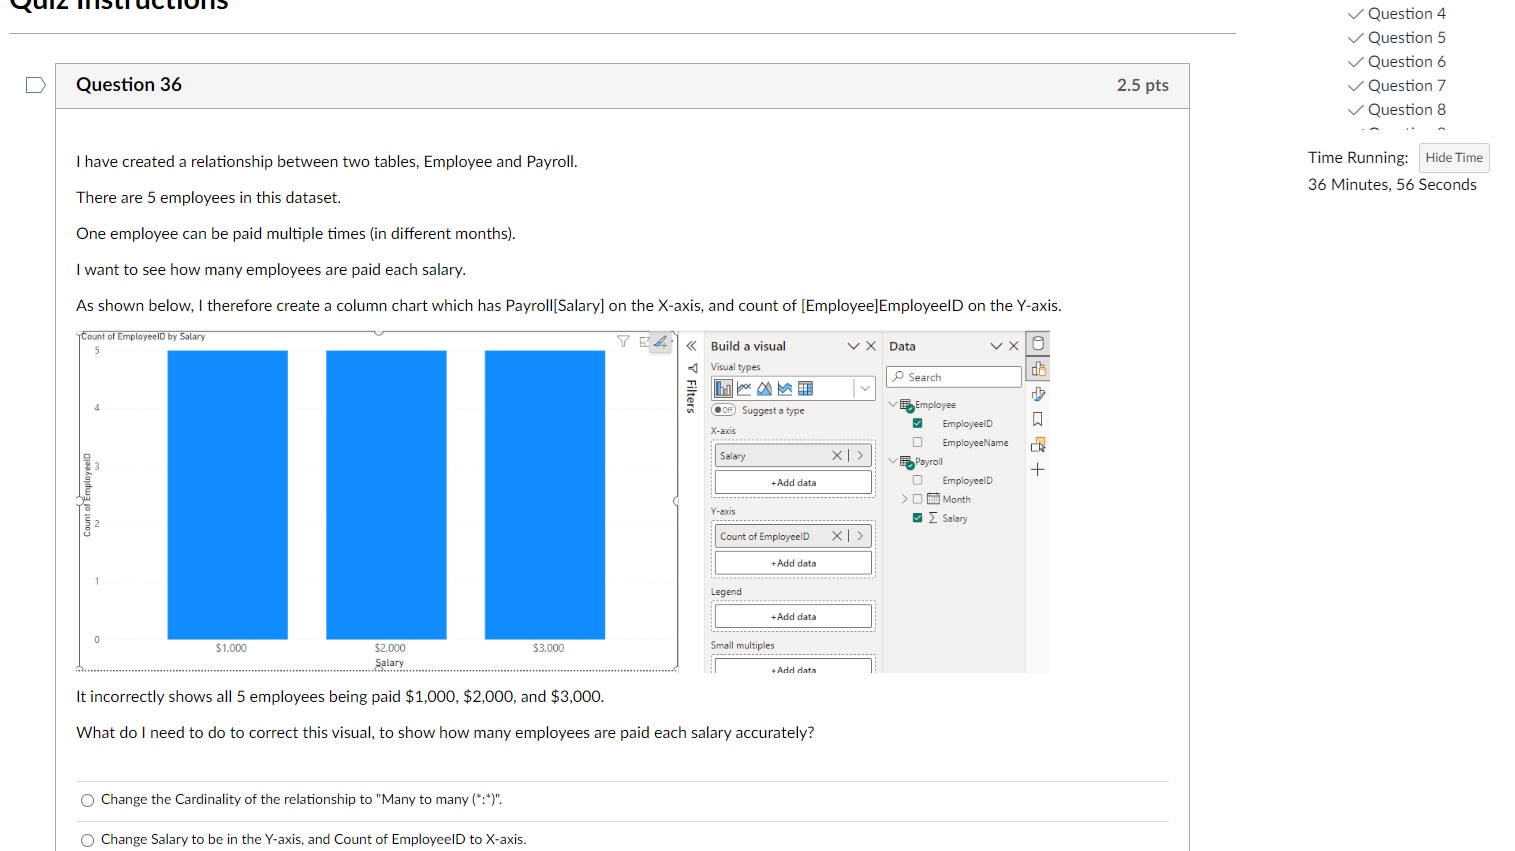
I have created a relationship between two tables, Employee and Payroll.
There are employees in this dataset.
One employee can be paid multiple times in different months
I want to see how many employees are paid each salary.
As shown below, I therefore create a column chart which has PayrollSalary on the Xaxis, and count of EmployeeEmployeeID on the Yaxis.
It incorrectly shows all employees being paid $$ and $
What do I need to do to correct this visual, to show how many employees are paid each salary accurately?
Change the Cardinality of the relationship to "Many to many
Change Salary to be in the axis, and Count of EmployeeID to axis.
Step by Step Solution
There are 3 Steps involved in it
1 Expert Approved Answer
Step: 1 Unlock

Question Has Been Solved by an Expert!
Get step-by-step solutions from verified subject matter experts
Step: 2 Unlock
Step: 3 Unlock