

Question: QUESTION 3 (7 Marks) To examine the volatility clustering phenomena in the foreign exchange rate market, a two- step test has been conducted on the
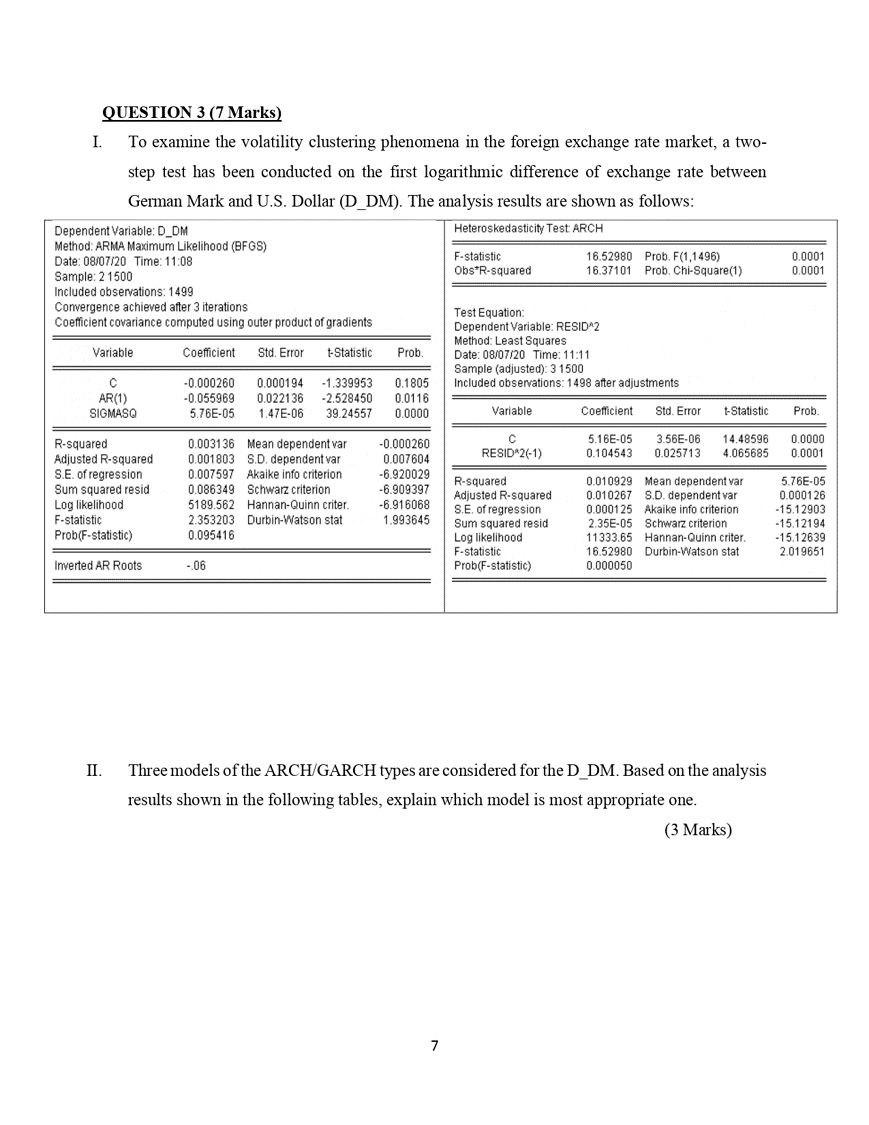
QUESTION 3 (7 Marks) To examine the volatility clustering phenomena in the foreign exchange rate market, a two- step test has been conducted on the first logarithmic difference of exchange rate between German Mark and U.S. Dollar (D_DM). The analysis results are shown as follows: Heteroskedasticity Test ARCH I. Dependent Variable: D_DM Method: ARMA Maximum Likelihood (BFGS) Date: 08/07/20 Time: 11:08 Sample: 21500 Included observations: 1499 Convergence achieved after 3 iterations Coefficient covariance computed using outer product of gradients Coefficient Std. Error t-Statistic Variable: C AR(1) SIGMASQ R-squared Adjusted R-squared S.E. of regression Sum squared resid Log likelihood F-statistic Prob(F-statistic) Inverted AR Roots -0.000260 0.000194 -1.339953 0.1805 -0.055969 0.022136 -2.528450 0.0116 5.76E-05 1.47E-06 39.24557 0.0000 0.003136 Mean dependent var 0.001803 S.D. dependent var 0.007597 Akalke info criterion 0.086349 Schwarz criterion 5189.562 Hannan-Quinn criter. 2.353203 Durbin-Watson stat 0.095416 Prob. -.06 -0.000260 0.007604 -6.920029 -6.909397 -6.916068 1.993645 F-statistic Obs*R-squared 7 Test Equation: Dependent Variable: RESID^2 Method: Least Squares Date: 08/07/20 Time: 11:11. Sample (adjusted): 31500 Included observations: 1498 after adjustments. Variable 16.52980 Prob. F(1,1496) 16.37101 Prob. Chi-Square(1) C RESID*2(-1) R-squared Adjusted R-squared S.E. of regression Sum squared resid Log likelihood F-statistic Prob(F-statistic) Coefficient Std. Error t-Statistic 5.16E-05 3.56E-06 14.48596 0.104543 0.025713 4.065685 0.010929 Mean dependent var 0.010267 S.D. dependent var 0.000125 Akaike info criterion 2.35E-05 Schwarz criterion 11333.65 Hannan-Quinn criter. 16.52980 Durbin-Watson stat 0.000050 II. Three models of the ARCH/GARCH types are considered for the D_DM. Based on the analysis results shown in the following tables, explain which model is most appropriate one. (3 Marks) 0.0001 0.0001 Prob. 0.0000 0.0001 5.76E-05 0.000126 -15.12903 -15.12194 -15.12639 2.019651 QUESTION 3 (7 Marks) To examine the volatility clustering phenomena in the foreign exchange rate market, a two- step test has been conducted on the first logarithmic difference of exchange rate between German Mark and U.S. Dollar (D_DM). The analysis results are shown as follows: Heteroskedasticity Test ARCH I. Dependent Variable: D_DM Method: ARMA Maximum Likelihood (BFGS) Date: 08/07/20 Time: 11:08 Sample: 21500 Included observations: 1499 Convergence achieved after 3 iterations Coefficient covariance computed using outer product of gradients Coefficient Std. Error t-Statistic Variable: C AR(1) SIGMASQ R-squared Adjusted R-squared S.E. of regression Sum squared resid Log likelihood F-statistic Prob(F-statistic) Inverted AR Roots -0.000260 0.000194 -1.339953 0.1805 -0.055969 0.022136 -2.528450 0.0116 5.76E-05 1.47E-06 39.24557 0.0000 0.003136 Mean dependent var 0.001803 S.D. dependent var 0.007597 Akalke info criterion 0.086349 Schwarz criterion 5189.562 Hannan-Quinn criter. 2.353203 Durbin-Watson stat 0.095416 Prob. -.06 -0.000260 0.007604 -6.920029 -6.909397 -6.916068 1.993645 F-statistic Obs*R-squared 7 Test Equation: Dependent Variable: RESID^2 Method: Least Squares Date: 08/07/20 Time: 11:11. Sample (adjusted): 31500 Included observations: 1498 after adjustments. Variable 16.52980 Prob. F(1,1496) 16.37101 Prob. Chi-Square(1) C RESID*2(-1) R-squared Adjusted R-squared S.E. of regression Sum squared resid Log likelihood F-statistic Prob(F-statistic) Coefficient Std. Error t-Statistic 5.16E-05 3.56E-06 14.48596 0.104543 0.025713 4.065685 0.010929 Mean dependent var 0.010267 S.D. dependent var 0.000125 Akaike info criterion 2.35E-05 Schwarz criterion 11333.65 Hannan-Quinn criter. 16.52980 Durbin-Watson stat 0.000050 II. Three models of the ARCH/GARCH types are considered for the D_DM. Based on the analysis results shown in the following tables, explain which model is most appropriate one. (3 Marks) 0.0001 0.0001 Prob. 0.0000 0.0001 5.76E-05 0.000126 -15.12903 -15.12194 -15.12639 2.019651
Step by Step Solution
There are 3 Steps involved in it

Get step-by-step solutions from verified subject matter experts