

Question: Question 3 8 ( 1 . 2 5 points ) An analyst uses Excel Solver to determine the optimal production quantities for a product. After
Question points
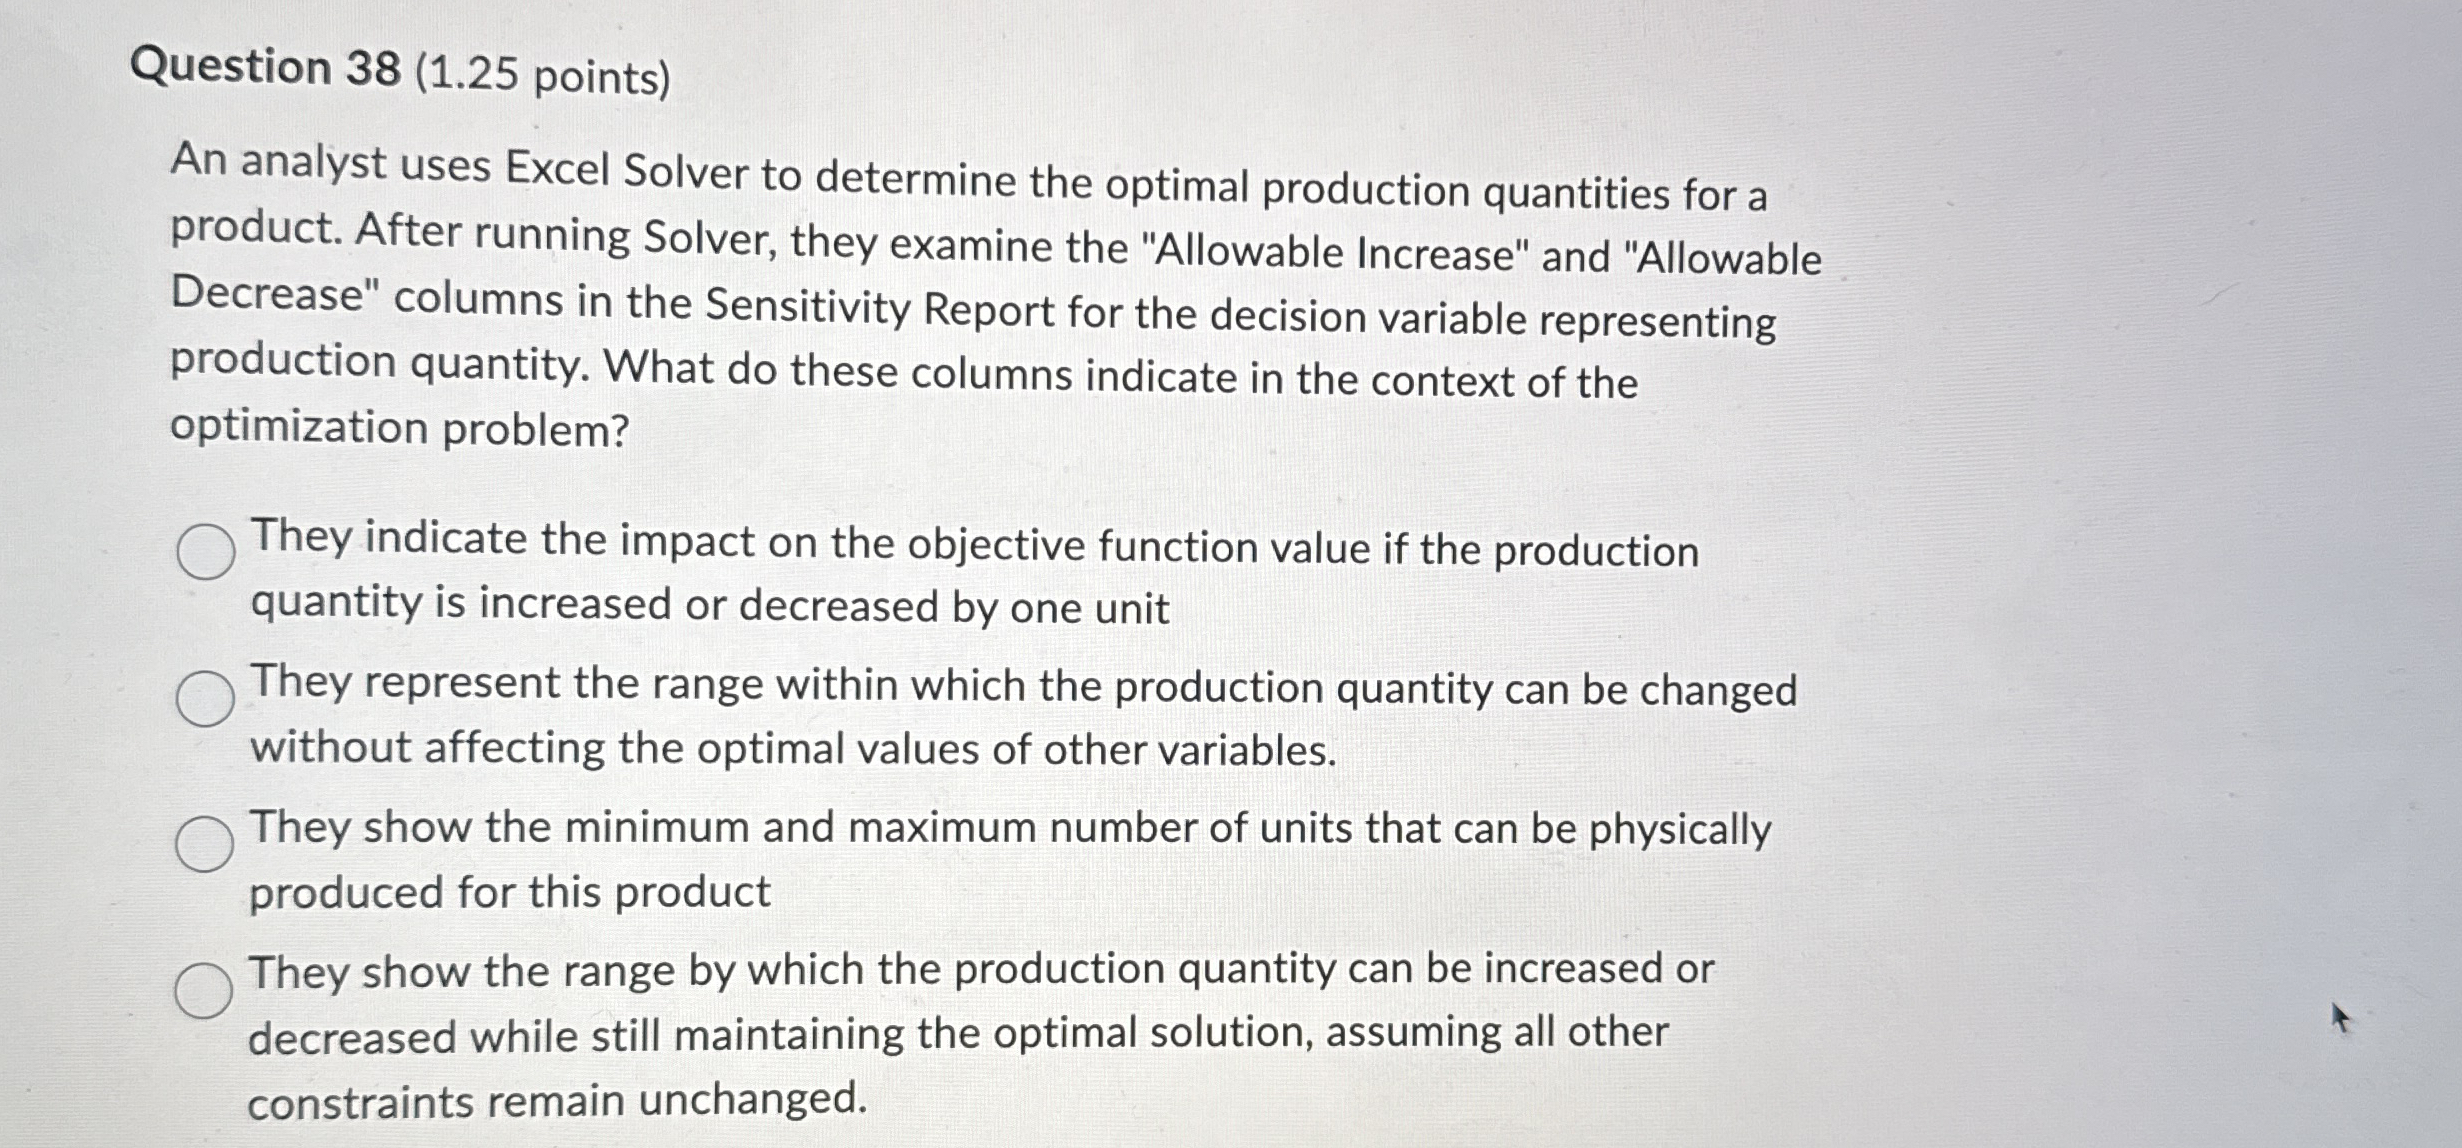
An analyst uses Excel Solver to determine the optimal production quantities for a product. After running Solver, they examine the "Allowable Increase" and "Allowable Decrease" columns in the Sensitivity Report for the decision variable representing production quantity. What do these columns indicate in the context of the optimization problem?
They indicate the impact on the objective function value if the production quantity is increased or decreased by one unit
They represent the range within which the production quantity can be changed without affecting the optimal values of other variables.
They show the minimum and maximum number of units that can be physically produced for this product
They show the range by which the production quantity can be increased or decreased while still maintaining the optimal solution, assuming all other constraints remain unchanged.
Step by Step Solution
There are 3 Steps involved in it
1 Expert Approved Answer
Step: 1 Unlock

Question Has Been Solved by an Expert!
Get step-by-step solutions from verified subject matter experts
Step: 2 Unlock
Step: 3 Unlock