

Question: QUESTION 3 ANOVA - Total Sales in Thousands Cases Sum of Squares df Mean F Square P Region 193.897 3 64.632 1.915 0.131 Residuals 3610.520
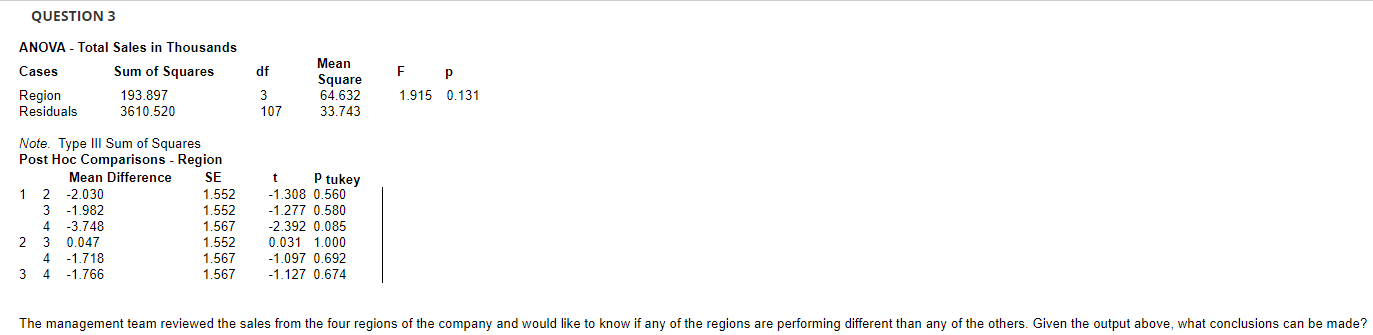

QUESTION 3 ANOVA - Total Sales in Thousands Cases Sum of Squares df Mean F Square P Region 193.897 3 64.632 1.915 0.131 Residuals 3610.520 107 33.743 Note. Type Ill Sum of Squares Post Hoc Comparisons - Region Mean Difference SE P tukey -2.030 1.552 -1.308 0.560 -1.982 1.552 -1.277 0.580 -3.748 1.567 -2.392 0.085 3 0.047 1.552 0.031 1.000 -1.718 1.567 -1.097 0.692 3 A -1.766 1.567 -1.127 0.674 The management team reviewed the sales from the four regions of the company and would like to know if any of the regions are performing different than any of the others. Given the output above, what conclusions can be made
Step by Step Solution
There are 3 Steps involved in it
1 Expert Approved Answer
Step: 1 Unlock

Question Has Been Solved by an Expert!
Get step-by-step solutions from verified subject matter experts
Step: 2 Unlock
Step: 3 Unlock