

Question: QUESTION 3 Based on the diagram below, fill in Table 1 for the price and quantity of Good A, B and C. Diagram 1: Demand
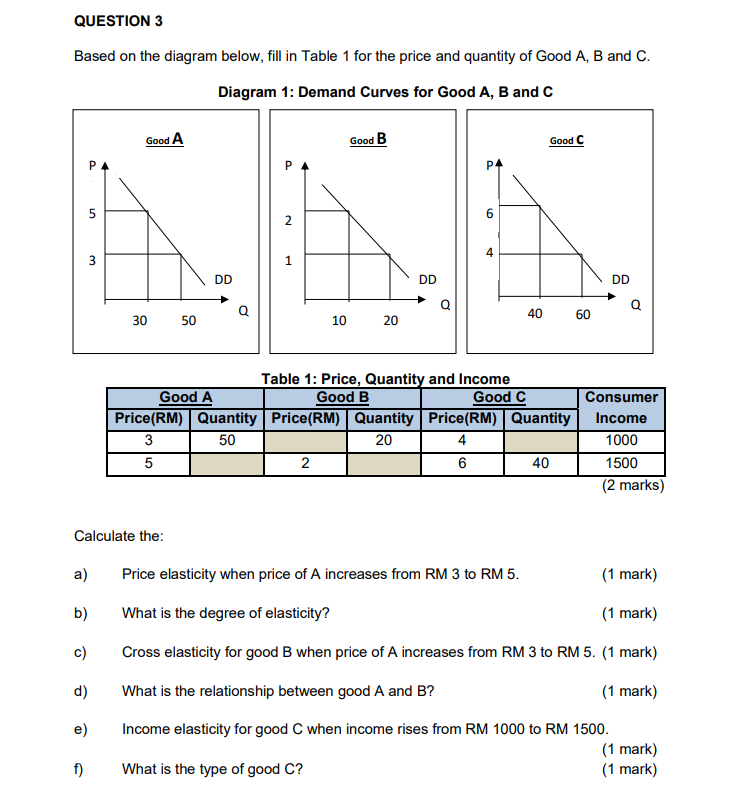
QUESTION 3 Based on the diagram below, fill in Table 1 for the price and quantity of Good A, B and C. Diagram 1: Demand Curves for Good A, B and C Good A Good B Good C P 5 2 3 1 DD DD DD Q 30 50 10 20 40 60 Table 1: Price, Quantity and Income Good A Good B Good C Consumer Price(RM) | Quantity | Price(RM) | Quantity Price (RM) | Quantity Income 3 50 20 4 1000 5 2 6 40 500 (2 marks) Calculate the: a) Price elasticity when price of A increases from RM 3 to RM 5. (1 mark) b) What is the degree of elasticity? (1 mark) c) Cross elasticity for good B when price of A increases from RM 3 to RM 5. (1 mark) d) What is the relationship between good A and B? (1 mark) e) Income elasticity for good C when income rises from RM 1000 to RM 1500. (1 mark) f) What is the type of good C? (1 mark)
Step by Step Solution
There are 3 Steps involved in it

Get step-by-step solutions from verified subject matter experts