

Question: Question 3 Below is a table containing summary statistics for monthly returns in excess of the risk free rate on three portfolios of UK stocks.
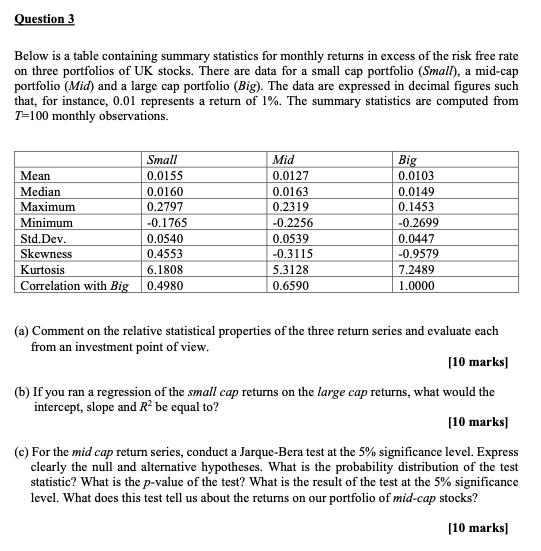
Question 3 Below is a table containing summary statistics for monthly returns in excess of the risk free rate on three portfolios of UK stocks. There are data for a small cap portfolio (Small), a mid-cap portfolio (Mid) and a large cap portfolio (Big). The data are expressed in decimal figures such that, for instance, 0.01 represents a return of 1%. The summary statistics are computed from 7=100 monthly observations. Small Mid Big Mean 0.0155 0.0127 0.0103 Median 0.0160 0.0163 0.0149 Maximum 0.2797 0.2319 0.1453 Minimum -0.1765 -0.2256 -0.2699 Std.Dev. 0.0540 0.0539 0.0447 Skewness 0.4553 -0.3115 -0.9579 Kurtosis 6.1808 5.3128 7.2489 Correlation with Big 0.4980 0.6590 1.0000 (a) Comment on the relative statistical properties of the three return series and evaluate each from an investment point of view. [10 marks] (b) If you ran a regression of the small cap returns on the large cap returns, what would the intercept, slope and R" be equal to? [10 marks] (c) For the mid cap return series, conduct a Jarque-Bera test at the 5% significance level. Express clearly the null and alternative hypotheses. What is the probability distribution of the test statistic? What is the p-value of the test? What is the result of the test at the 5% significance level. What does this test tell us about the returns on our portfolio of mid-cap stocks? [10 marks]
Step by Step Solution
There are 3 Steps involved in it

Get step-by-step solutions from verified subject matter experts