

Question: Question 3 - c: The table below displays the flow rates from a flood event on a 4 0 0 k m 2 catchment because
Question c:
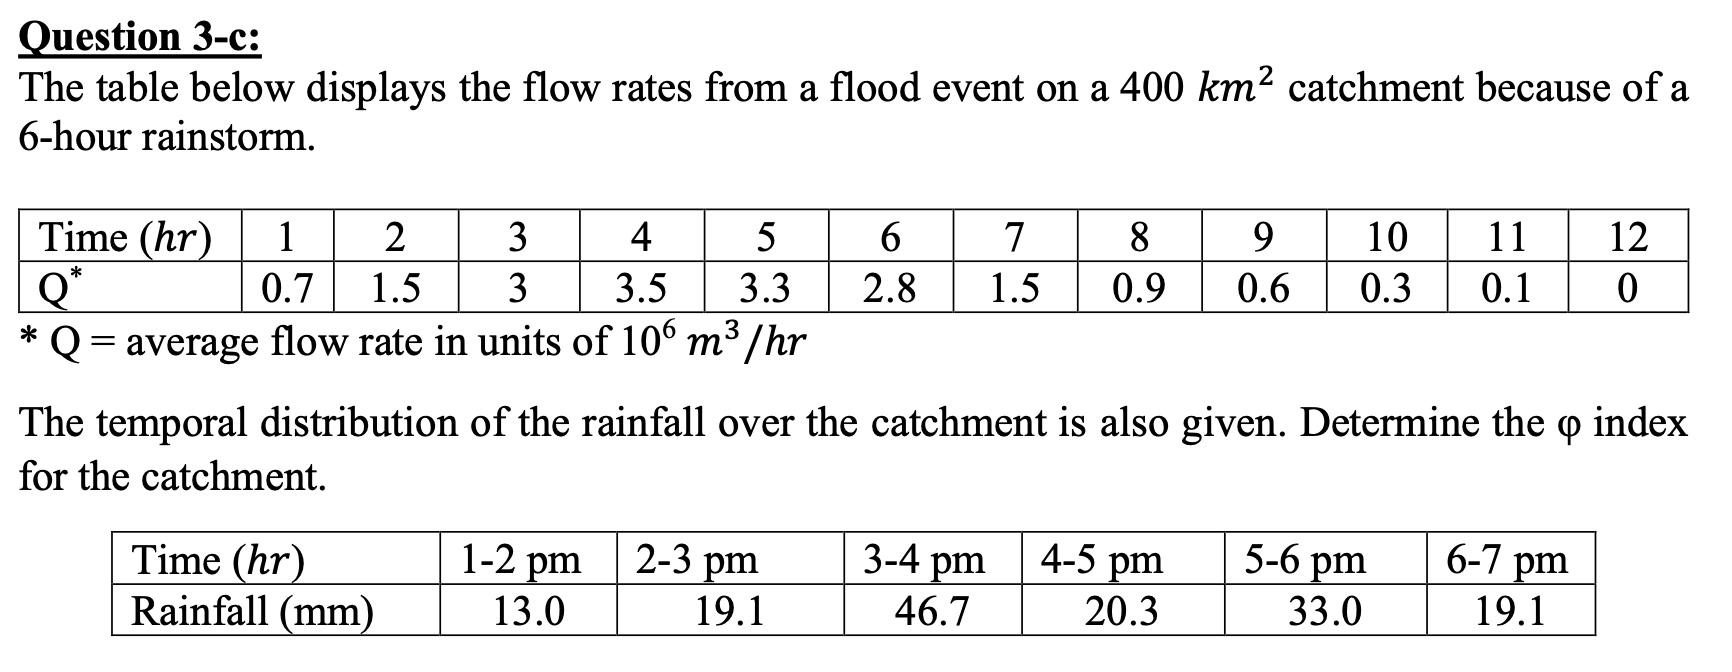
The table below displays the flow rates from a flood event on a catchment because of a
hour rainstorm.
average flow rate in units of
The temporal distribution of the rainfall over the catchment is also given. Determine the index
for the catchment.
Step by Step Solution
There are 3 Steps involved in it
1 Expert Approved Answer
Step: 1 Unlock

Question Has Been Solved by an Expert!
Get step-by-step solutions from verified subject matter experts
Step: 2 Unlock
Step: 3 Unlock