

Question: Question 3: Consider the following data showing the demand schedule for tickets to an event Price Quantity Demanded 50 0 40 4 30 8 20
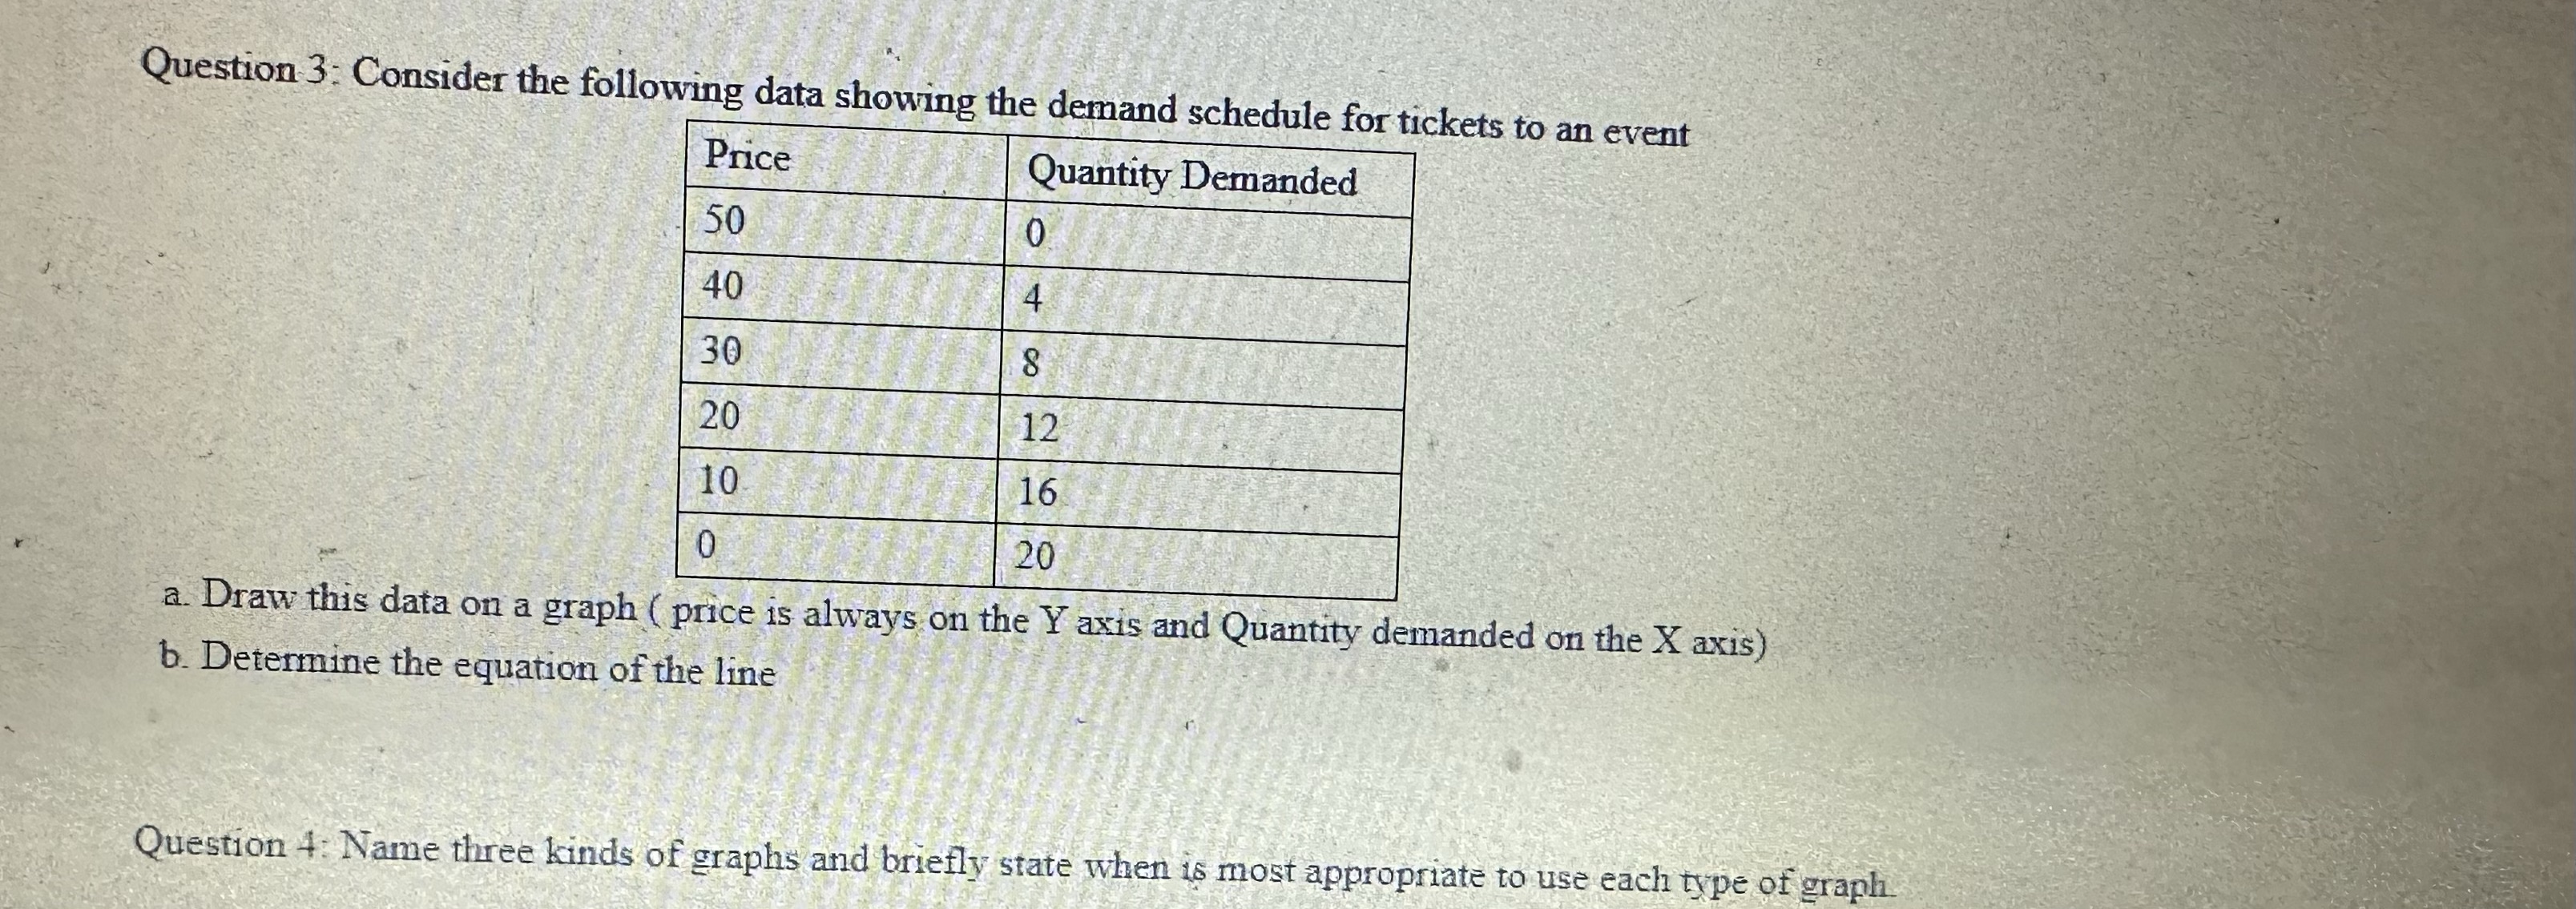
Question 3: Consider the following data showing the demand schedule for tickets to an event Price Quantity Demanded 50 0 40 4 30 8 20 12 10 16 0 20 a. Draw this data on a graph ( price is always on the Y axis and Quantity demanded on the X axis) b. Determine the equation of the line Question 4: Name three kinds of graphs and briefly state when is most appropriate to use each type of graph
Step by Step Solution
There are 3 Steps involved in it
1 Expert Approved Answer
Step: 1 Unlock

Question Has Been Solved by an Expert!
Get step-by-step solutions from verified subject matter experts
Step: 2 Unlock
Step: 3 Unlock