

Question: Question 3. Control Charts for Variables A machine is used to fill cans with an energy drink. A single sample can is selected every
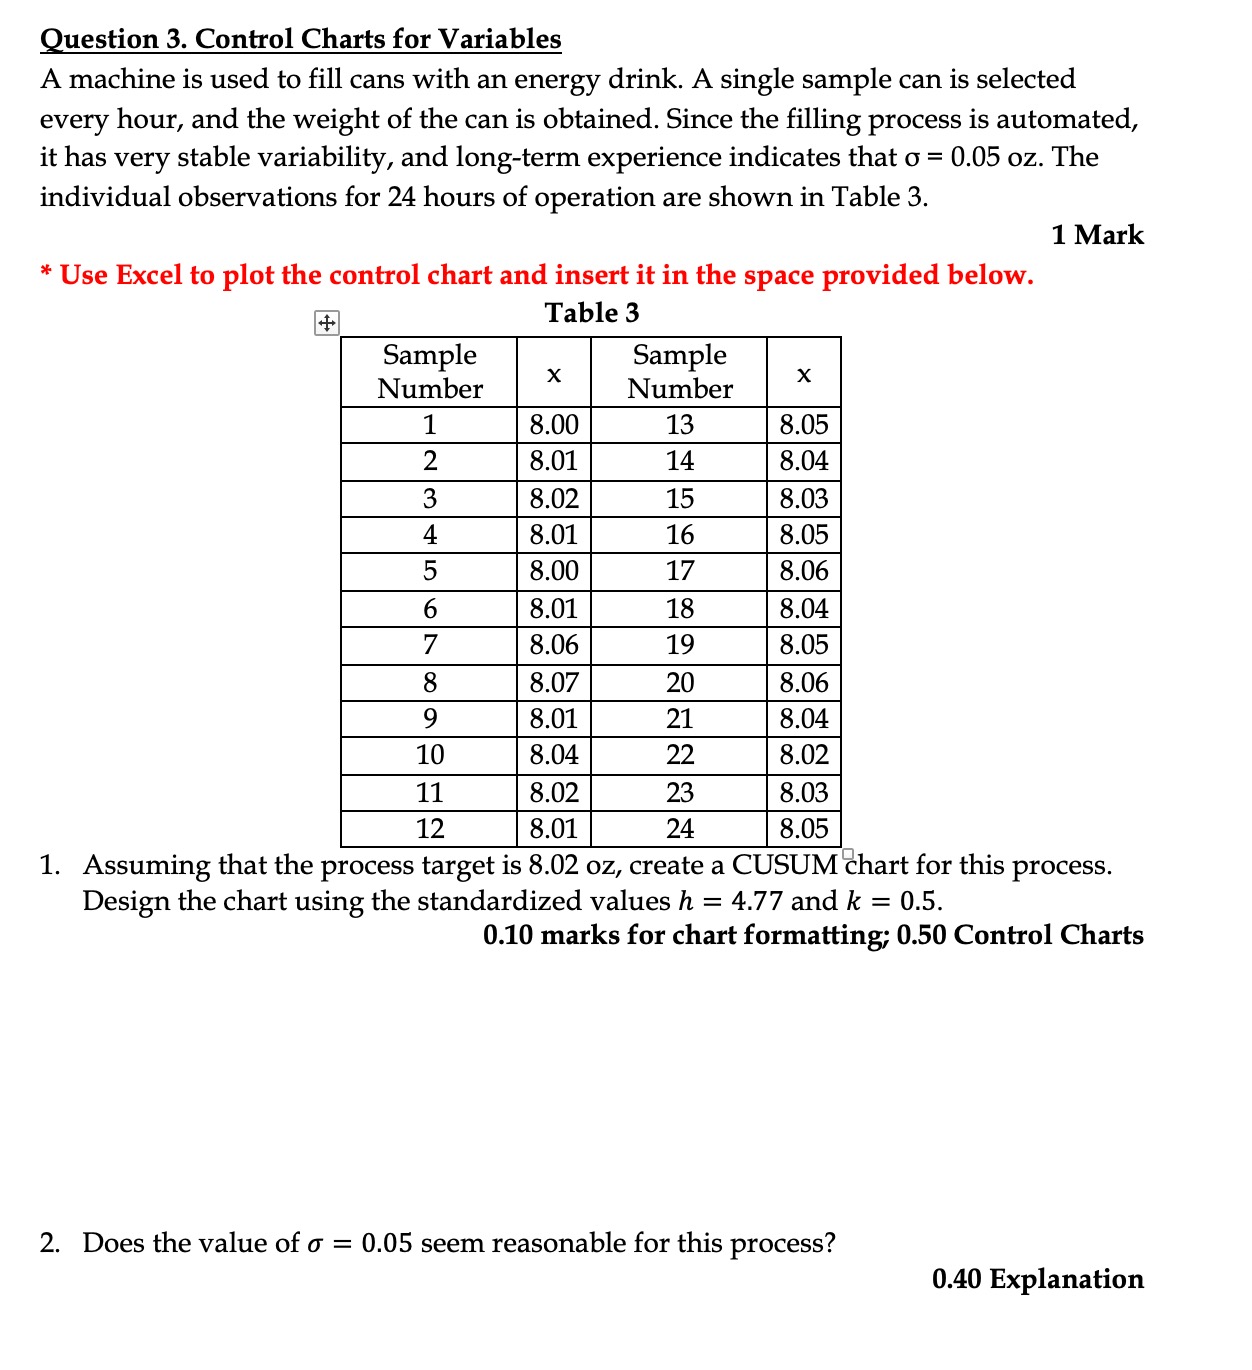
Question 3. Control Charts for Variables A machine is used to fill cans with an energy drink. A single sample can is selected every hour, and the weight of the can is obtained. Since the filling process is automated, it has very stable variability, and long-term experience indicates that = 0.05 oz. The individual observations for 24 hours of operation are shown in Table 3. * Use Excel to plot the control chart and insert it in the space provided below. 1 Mark + Table 3 Sample X Number Sample Number X 1 8.00 13 8.05 2 8.01 14 8.04 3 8.02 15 8.03 4 8.01 16 8.05 5 8.00 17 8.06 6 8.01 18 8.04 7 8.06 19 8.05 8 8.07 20 8.06 9 8.01 21 8.04 10 8.04 22 8.02 11 8.02 23 8.03 12 8.01 24 8.05 1. Assuming that the process target is 8.02 oz, create a CUSUM chart for this process. Design the chart using the standardized values h = 4.77 and k = 0.5. 0.10 marks for chart formatting; 0.50 Control Charts 2. Does the value of = 0.05 seem reasonable for this process? 0.40 Explanation
Step by Step Solution
There are 3 Steps involved in it

Get step-by-step solutions from verified subject matter experts