

Question: Question 3 For the table below: Month Production en T 20 IT 25 30 35 40 10 Points 1. Determine the equation trendline: The
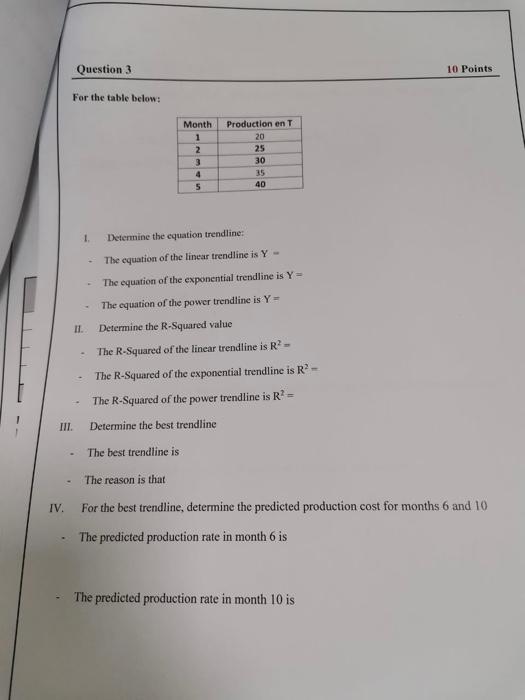
Question 3 For the table below: Month Production en T 20 IT 25 30 35 40 10 Points 1. Determine the equation trendline: The equation of the linear trendline is Y- The equation of the exponential trendline is Y= The equation of the power trendline is Y = 11. Determine the R-Squared value - The R-Squared of the linear trendline is R2. The R-Squared of the exponential trendline is R2- The R-Squared of the power trendline is R= III. Determine the best trendline The best trendline is The reason is that For the best trendline, determine the predicted production cost for months 6 and 10 The predicted production rate in month 6 is IV. The predicted production rate in month 10 is
Step by Step Solution
There are 3 Steps involved in it

Get step-by-step solutions from verified subject matter experts