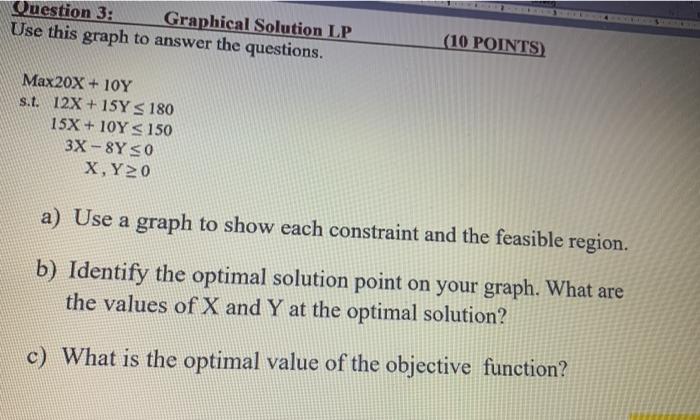
Question: Question 3: Graphical Solution LP Use this graph to answer the questions. (10 POINTS) Max20x + 10Y s.t. 12X+15Y 5 180 15X + 10Y 150

Question 3: Graphical Solution LP Use this graph
Question 3: Graphical Solution LP Use this graph to answer the questions. (10 POINTS) Max20x + 10Y s.t. 12X+15Y 5 180 15X + 10Y 150 3X-8Y0 X, Y20 a) Use a graph to show each constraint and the feasible region. b) Identify the optimal solution point on your graph. What are the values of X and Y at the optimal solution? c) What is the optimal value of the objective function

Step by Step Solution

There are 3 Steps involved in it

1 Expert Approved Answer
Step: 1 Unlock blur-text-image
Question Has Been Solved by an Expert!

Get step-by-step solutions from verified subject matter experts

Step: 2 Unlock
Step: 3 Unlock

Students Have Also Explored These Related General Management Questions!