

Question: Question 3 ( i ) Figure 1 below illustrates the Fault Tree Analysis used to investigate the root causes of the wrong raw material being
Question
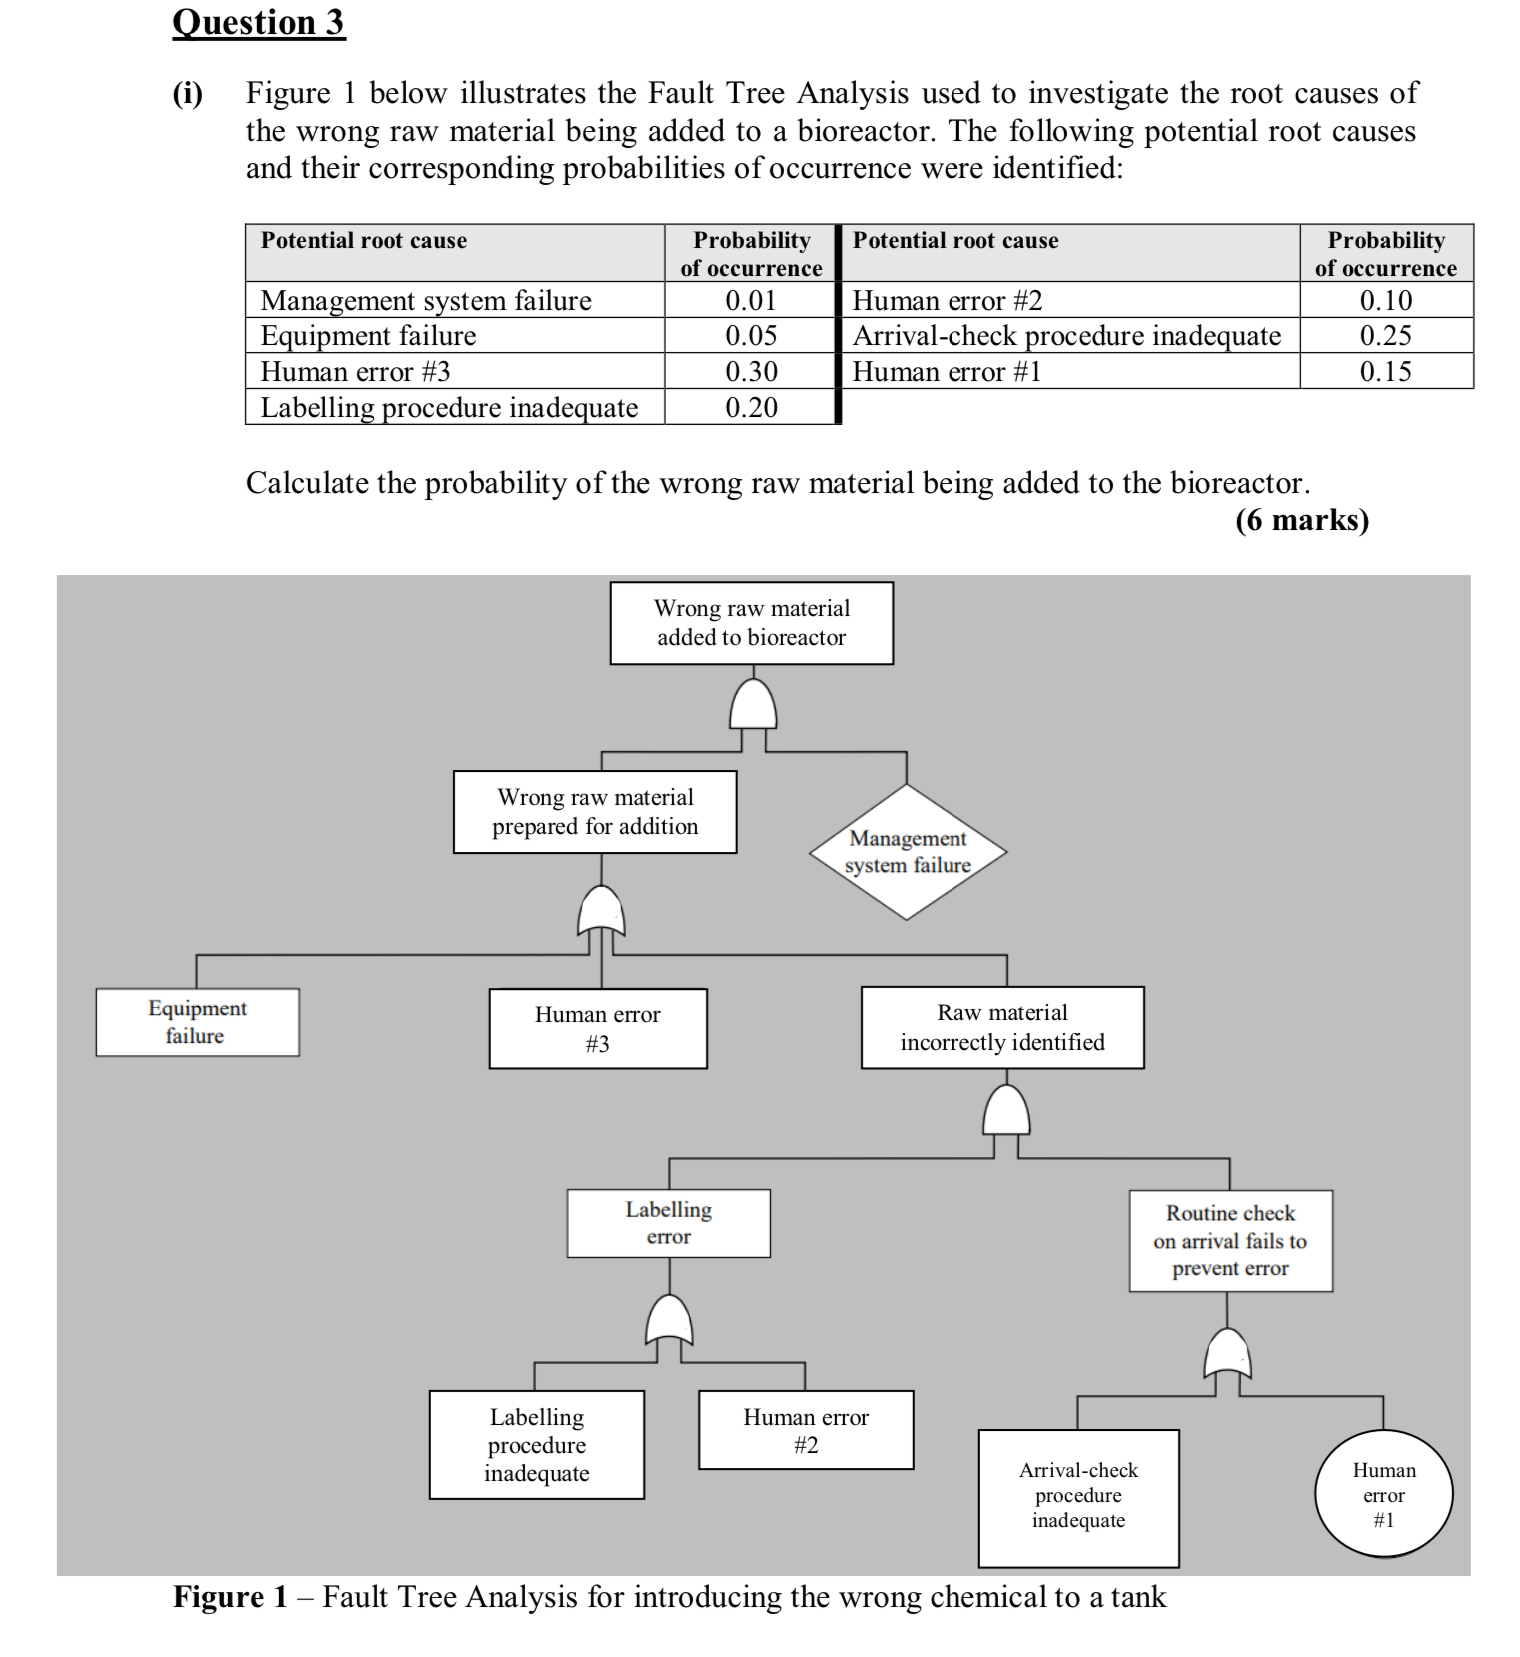
i Figure below illustrates the Fault Tree Analysis used to investigate the root causes of the wrong raw material being added to a bioreactor. The following potential root causes and their corresponding probabilities of occurrence were identified:
tablePotential root cause,tableProbabilityof occurrenceManagement system failure,Equipment failure,Human error #Labelling procedure inadequate,
tablePotential root cause,tableProbabilityof occurrenceHuman error #Arrivalcheck procedure inadequate,Human error #
Calculate the probability of the wrong raw material being added to the bioreactor. marks
Figure Fault Tree Analysis for introducing the wrong chemical to a tank
Step by Step Solution
There are 3 Steps involved in it
1 Expert Approved Answer
Step: 1 Unlock

Question Has Been Solved by an Expert!
Get step-by-step solutions from verified subject matter experts
Step: 2 Unlock
Step: 3 Unlock