

Question: QUESTION 3 In the graph below, which depicts the relationship between units produced and unit cost, the dotted line depicts which type of cost per
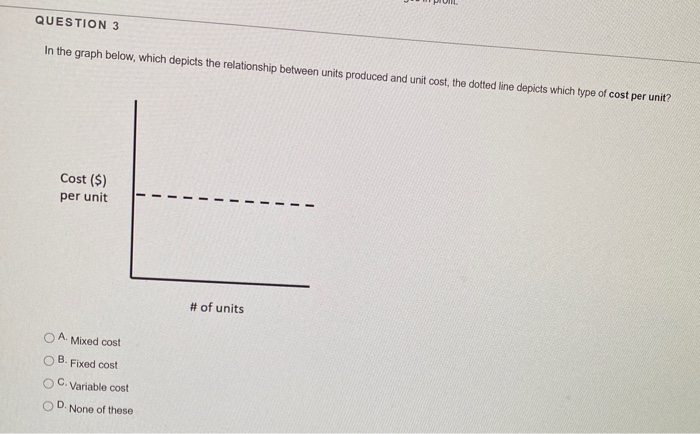
QUESTION 3 In the graph below, which depicts the relationship between units produced and unit cost, the dotted line depicts which type of cost per unit? Cost ($) per unit # of units A. Mixed cost OB. Fixed cost OC. Variable cost D None of these
Step by Step Solution
There are 3 Steps involved in it
1 Expert Approved Answer
Step: 1 Unlock

Question Has Been Solved by an Expert!
Get step-by-step solutions from verified subject matter experts
Step: 2 Unlock
Step: 3 Unlock