Question: Question 3 Is there a relationship between Weekly $ Ad Expense (x) and Weekly $ Sales (y)? 1. Draw a Scatterplot using the chart drawing

Question 3Question 3 Is there a relationship between Weekly

Is there a relationship between Weekly $ Ad Expense (x) and Weekly $ Sales (y)? 1. Draw a Scatterplot using the chart drawing tools. 2. Add a trendline to the Scatterplot and display the Equation of the Line and the R squared value. Put in a Chart Title of "Weekly Sales and Expense" and also put in Titles for X and Y. 3. What does the R squared value tell you about how close the data are to the fitted regression line? Place your answer for #3 here. Place your Scatterplot here. Weekly Sales and Expense 800,000 700,000 y = 8.2415x + 38357 R = 0.842 600,000 Weekly $ Sales (y) 500,000 400,000 300,000 200,000 100,000 0 0 10,000 50,000 60,000 70,000 20,000 30,000 40,000 Weekly $ Ad Expense (x)

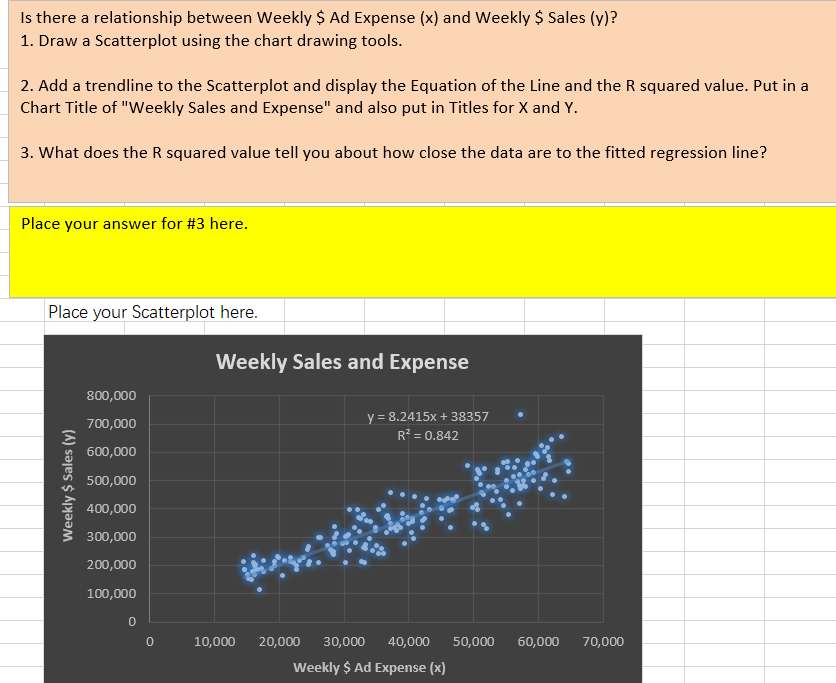
Step by Step Solution

There are 3 Steps involved in it

1 Expert Approved Answer
Step: 1 Unlock blur-text-image
Question Has Been Solved by an Expert!

Get step-by-step solutions from verified subject matter experts

Step: 2 Unlock
Step: 3 Unlock

Students Have Also Explored These Related General Management Questions!