

Question: Question 3 - Matplotlib ( 2 4 Pts ) Implement the following tasks by using Matplotlib library. [ Task - 3 . 1 ] (
Question Matplotlib Pts
Implement the following tasks by using Matplotlib library.
Task Pts Plot sine cosine, tangent, and cotangent functions as by subplots inside one figure. For all functions, set the range of axis between and For the sine and cosine, set the range of axis between and For the tangent and cotangent, adjust the range of axis to avoid extreme values. Split the grids into equal portions in and axis. Set different colors for each function graph. Draw tangent and cotangent graphs with dashed lines. Add a legend to the upper right corner of each subplot. Add title to each subplot.
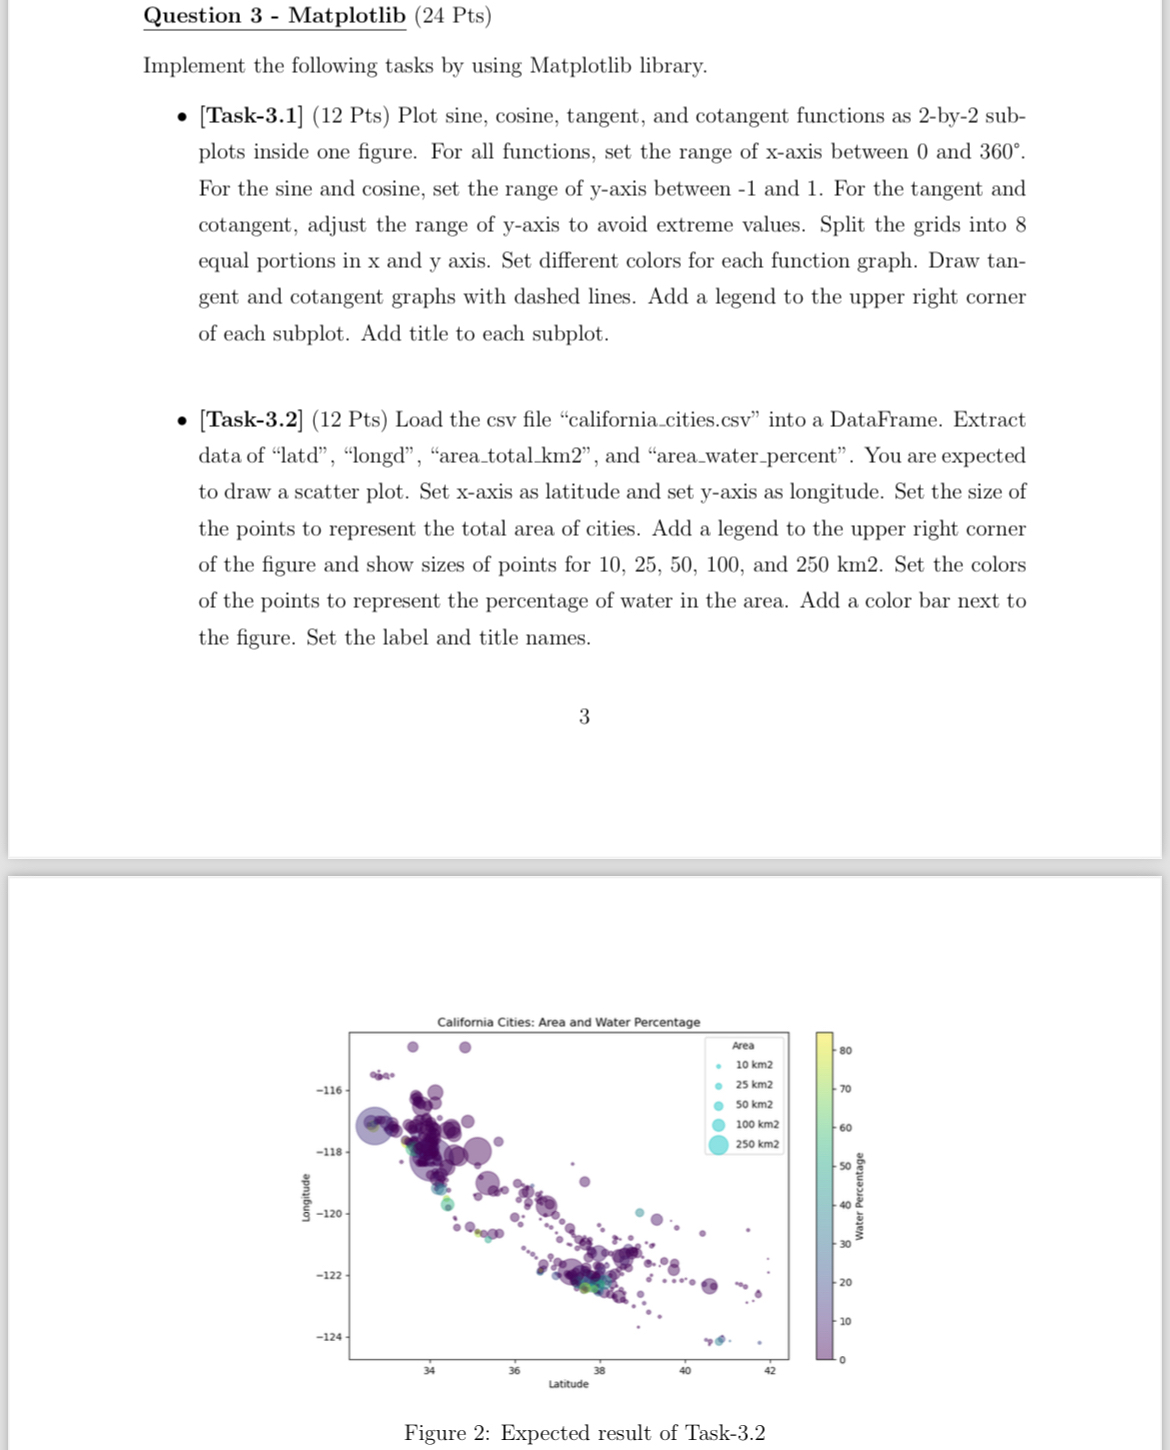
Task Pts Load the csv file "californiacities.csv into a DataFrame. Extract data of "latd", "longd", "areatotalkm and "areawaterpercent". You are expected to draw a scatter plot. Set xaxis as latitude and set axis as longitude. Set the size of the points to represent the total area of cities. Add a legend to the upper right corner of the figure and show sizes of points for and Set the colors of the points to represent the percentage of water in the area. Add a color bar next to the figure. Set the label and title names.
Figure : Expected result of Task
Step by Step Solution
There are 3 Steps involved in it
1 Expert Approved Answer
Step: 1 Unlock

Question Has Been Solved by an Expert!
Get step-by-step solutions from verified subject matter experts
Step: 2 Unlock
Step: 3 Unlock