

Question: QUESTION 3 Model Summary Adjusted R Std. Error of Model R R Square Square the Estimate 1 647 419 413 62.002 a. Predictors: (Constant), product
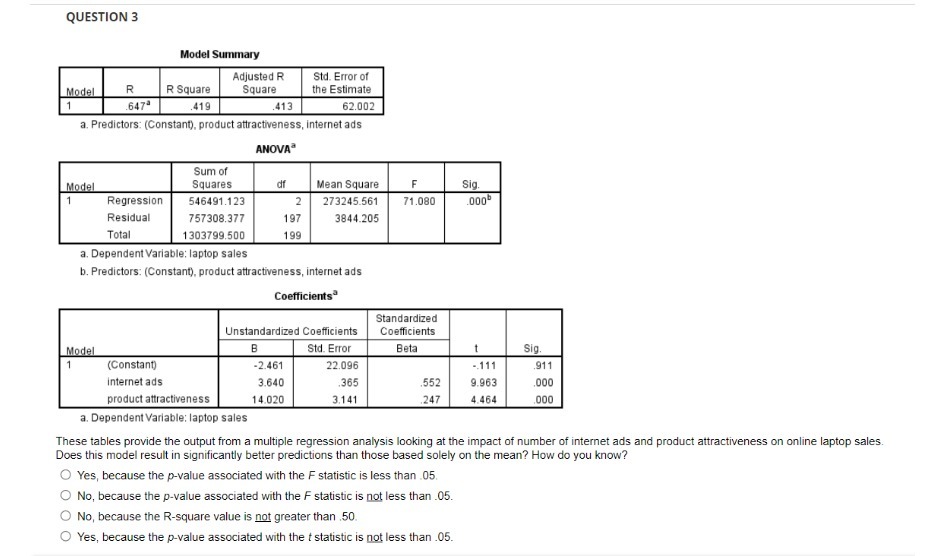
QUESTION 3 Model Summary Adjusted R Std. Error of Model R R Square Square the Estimate 1 647 419 413 62.002 a. Predictors: (Constant), product attractiveness, internet ads ANOVA Sum of Model Squares cdf Mean Square F Sig 1 Regression 546491.123 2 273245.561 71.080 Residual 757308.377 197 3844.205 Total 1303799.500 199 a, Dependent Variable: laptop sales b. Predictors: (Constant), product attractiveness, internet ads Coefficients Standardized Unstandardized Coefficients Coefficients Model B Std. Error Beta Sig (Constant) -2.461 22.096 -.111 911 internet ads 3.640 365 552 9.963 .000 product attractiveness 14.020 3.141 247 4.464 000 a. Dependent Variable: laptop sales These tables provide the output from a multiple regression analysis looking at the impact of number of internet ads and product attractiveness on online laptop sales Does this model result in significantly better predictions than those based solely on the mean? How do you know? O Yes, because the p-value associated with the F statistic is less than .05. No, because the p-value associated with the F statistic is not less than .05. O No, because the R-square value is not greater than .50 O Yes, because the p-value associated with the t statistic is not less than .05
Step by Step Solution
There are 3 Steps involved in it

Get step-by-step solutions from verified subject matter experts