

Question: QUESTION 3 Nominal comparison can better visualized with bar chart box plot line chart pie chart QUESTION 4 When dot plot is a better choice
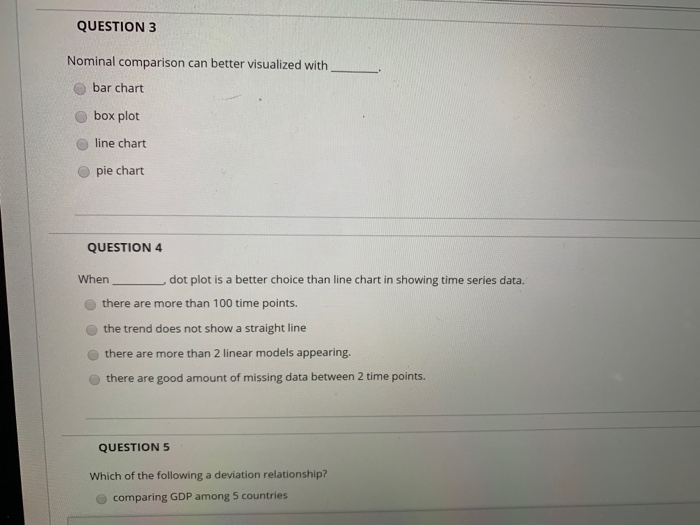
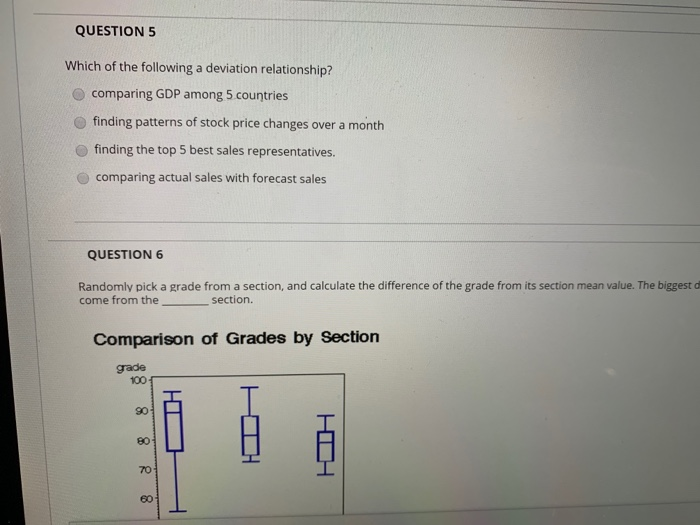
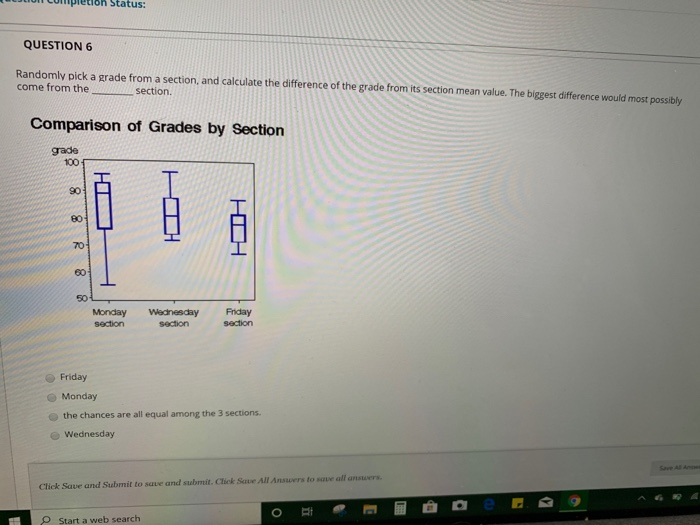
QUESTION 3 Nominal comparison can better visualized with bar chart box plot line chart pie chart QUESTION 4 When dot plot is a better choice than line chart in showing time series data. there are more than 100 time points. the trend does not show a straight line there are more than 2 linear models appearing. there are good amount of missing data between 2 time points. QUESTION 5 Which of the following a deviation relationship? comparing GDP among 5 countries QUESTION 5 Which of the following a deviation relationship? comparing GDP among 5 countries finding patterns of stock price changes over a month finding the top 5 best sales representatives. comparing actual sales with forecast sales QUESTION 6 Randomly pick a grade from a section, and calculate the difference of the grade from its section mean value. The biggest d come from the section. Comparison of Grades by Section grade 1001 8 38 Completion Status: QUESTION 6 Randomly pick a grade from a section, and calculate the difference of the grade from its section mean value. The biggest difference would most possibly come from the section. Comparison of Grades by Section grade 100 88 HD 601 Monday section Wednesday section Friday section Friday Monday the chances are all equal among the 3 sections. Wednesday SAA Click Save and Submit to save and submit. Click Save All Answers to me all answers. Start a web search
Step by Step Solution
There are 3 Steps involved in it

Get step-by-step solutions from verified subject matter experts