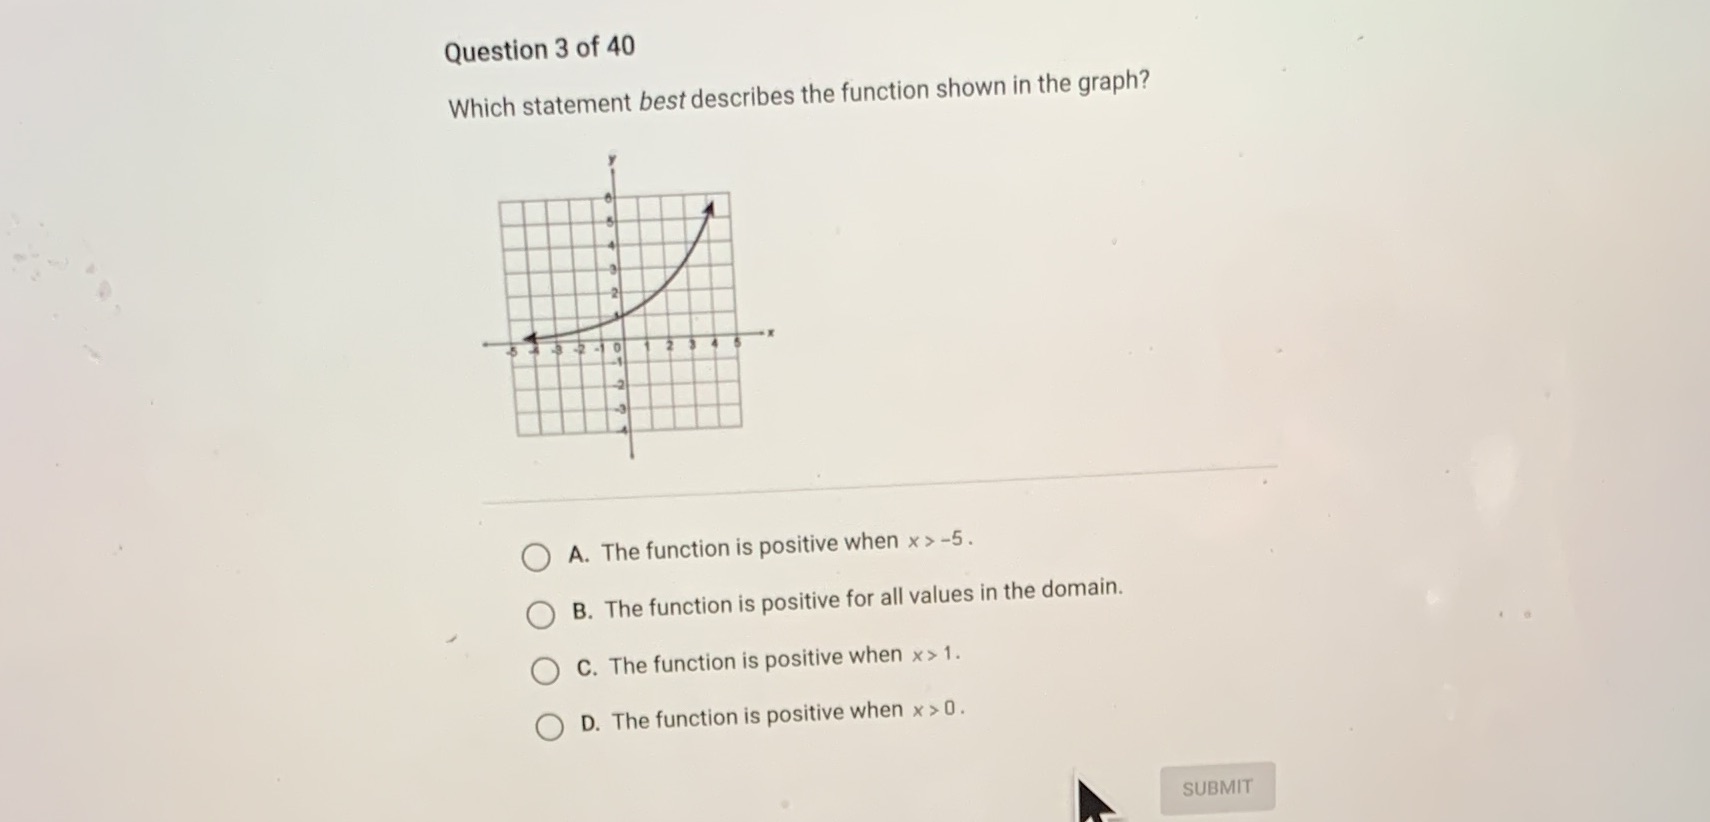
Question: Question 3 of 40 Which statement best describes the function shown in the graph? A. The function is positive when x > -5. O B.

Question 3 of 40 Which statement best describes
Question 3 of 40 Which statement best describes the function shown in the graph? A. The function is positive when x > -5. O B. The function is positive for all values in the domain. O C. The function is positive when x > 1. O D. The function is positive when x > 0. SUBMIT

Step by Step Solution

There are 3 Steps involved in it

1 Expert Approved Answer
Step: 1 Unlock blur-text-image
Question Has Been Solved by an Expert!

Get step-by-step solutions from verified subject matter experts

Step: 2 Unlock
Step: 3 Unlock

Students Have Also Explored These Related Mathematics Questions!