Question: Question #3 please can be handwritten or uploaded with Microsoft Word, thanks. Need to show work. You are Cindy, completing the analysis and developing a
 Question #3 please can be handwritten or uploaded with Microsoft Word, thanks. Need to show work.
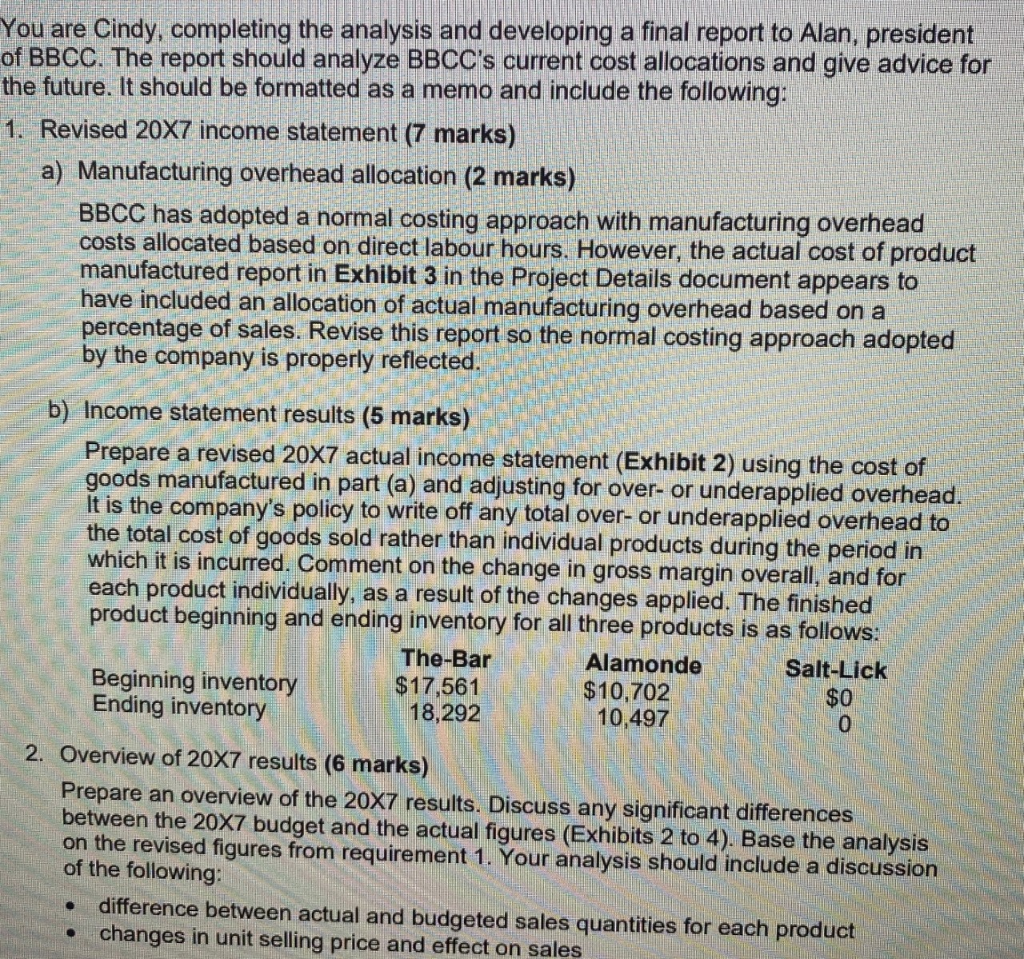
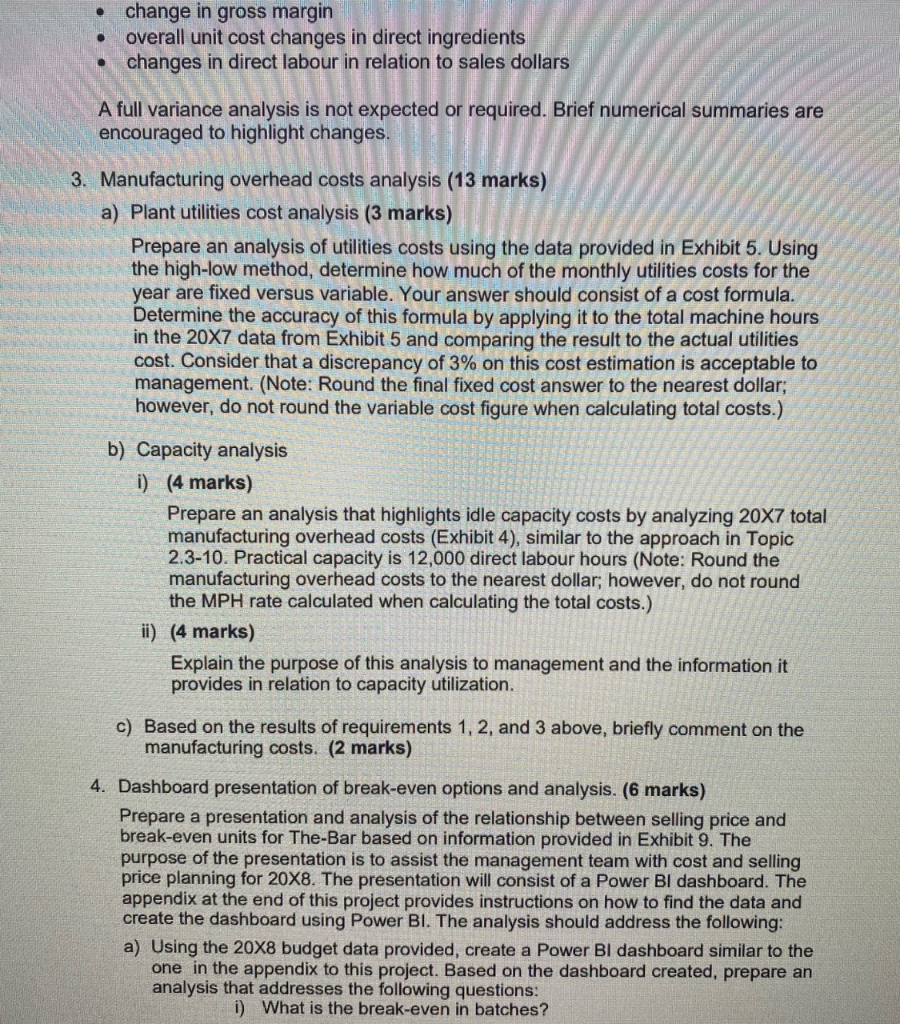
You are Cindy, completing the analysis and developing a final report to Alan, president of BBCC. The report should analyze BBCC's current cost allocations and give advice for the future. It should be formatted as a memo and include the following: 1. Revised 20X7 income statement (7 marks) a) Manufacturing overhead allocation (2 marks) BBCC has adopted a normal costing approach with manufacturing overhead costs allocated based on direct labour hours. However, the actual cost of product manufactured report in Exhibit 3 in the Project Details document appears to have included an allocation of actual manufacturing overhead based on a percentage of sales. Revise this report so the normal costing approach adopted by the company is properly reflected. b) Income statement results (5 marks) Prepare a revised 20X7 actual income statement (Exhibit 2) using the cost of goods manufactured in part (a) and adjusting for over- or underapplied overhead. It is the company's policy to write off any total over- or underapplied overhead to the total cost of goods sold rather than individual products during the period in which it is incurred. Comment on the change in gross margin overall, and for each product individually, as a result of the changes applied. The finished product beginning and ending inventory for all three products is as follows: The-Bar Alamonde Salt-Lick Beginning inventory $17,561 $10,702 $0 Ending inventory 18,292 10,497 2. Overview of 20X7 results (6 marks) Prepare an overview of the 20x7 results. Discuss any significant differences between the 20x7 budget and the actual figures (Exhibits 2 to 4). Base the analysis on the revised figures from requirement 1. Your analysis should include a discussion of the following: difference between actual and budgeted sales quantities for each product changes in unit selling price and effect on sales . . . change in gross margin overall unit cost changes in direct ingredients changes in direct labour in relation to sales dollars A full variance analysis is not expected or required. Brief numerical summaries are encouraged to highlight changes. 3. Manufacturing overhead costs analysis (13 marks) a) Plant utilities cost analysis (3 marks) Prepare an analysis of utilities costs using the data provided in Exhibit 5. Using the high-low method, determine how much of the monthly utilities costs for the year are fixed versus variable. Your answer should consist of a cost formula. Determine the accuracy of this formula by applying it to the total machine hours in the 20X7 data from Exhibit 5 and comparing the result to the actual utilities cost. Consider that a discrepancy of 3% on this cost estimation is acceptable to management. (Note: Round the final fixed cost answer to the nearest dollar; however, do not round the variable cost figure when calculating total costs.) b) Capacity analysis i) (4 marks) Prepare an analysis that highlights idle capacity costs by analyzing 20x7 total manufacturing overhead costs (Exhibit 4), similar to the approach in Topic 2.3-10. Practical capacity is 12,000 direct labour hours (Note: Round the manufacturing overhead costs to the nearest dollar; however, do not round the MPH rate calculated when calculating the total costs.) ii) (4 marks) Explain the purpose of this analysis to management and the information it provides in relation to capacity utilization. c) Based on the results of requirements 1, 2, and 3 above, briefly comment on the manufacturing costs. (2 marks) 4. Dashboard presentation of break-even options and analysis. (6 marks) Prepare a presentation and analysis of the relationship between selling price and break-even units for The-Bar based on information provided in Exhibit 9. The purpose of the presentation is to assist the management team with cost and selling price planning for 20X8. The presentation will consist of a Power BI dashboard. The appendix at the end of this project provides instructions on how to find the data and create the dashboard using Power BI. The analysis should address the following: a) Using the 20X8 budget data provided, create a Power BI dashboard similar to the one in the appendix to this project. Based on the dashboard created, prepare an analysis that addresses the following questions: i) What is the break-even in batches? You are Cindy, completing the analysis and developing a final report to Alan, president of BBCC. The report should analyze BBCC's current cost allocations and give advice for the future. It should be formatted as a memo and include the following: 1. Revised 20X7 income statement (7 marks) a) Manufacturing overhead allocation (2 marks) BBCC has adopted a normal costing approach with manufacturing overhead costs allocated based on direct labour hours. However, the actual cost of product manufactured report in Exhibit 3 in the Project Details document appears to have included an allocation of actual manufacturing overhead based on a percentage of sales. Revise this report so the normal costing approach adopted by the company is properly reflected. b) Income statement results (5 marks) Prepare a revised 20X7 actual income statement (Exhibit 2) using the cost of goods manufactured in part (a) and adjusting for over- or underapplied overhead. It is the company's policy to write off any total over- or underapplied overhead to the total cost of goods sold rather than individual products during the period in which it is incurred. Comment on the change in gross margin overall, and for each product individually, as a result of the changes applied. The finished product beginning and ending inventory for all three products is as follows: The-Bar Alamonde Salt-Lick Beginning inventory $17,561 $10,702 $0 Ending inventory 18,292 10,497 2. Overview of 20X7 results (6 marks) Prepare an overview of the 20x7 results. Discuss any significant differences between the 20x7 budget and the actual figures (Exhibits 2 to 4). Base the analysis on the revised figures from requirement 1. Your analysis should include a discussion of the following: difference between actual and budgeted sales quantities for each product changes in unit selling price and effect on sales . . . change in gross margin overall unit cost changes in direct ingredients changes in direct labour in relation to sales dollars A full variance analysis is not expected or required. Brief numerical summaries are encouraged to highlight changes. 3. Manufacturing overhead costs analysis (13 marks) a) Plant utilities cost analysis (3 marks) Prepare an analysis of utilities costs using the data provided in Exhibit 5. Using the high-low method, determine how much of the monthly utilities costs for the year are fixed versus variable. Your answer should consist of a cost formula. Determine the accuracy of this formula by applying it to the total machine hours in the 20X7 data from Exhibit 5 and comparing the result to the actual utilities cost. Consider that a discrepancy of 3% on this cost estimation is acceptable to management. (Note: Round the final fixed cost answer to the nearest dollar; however, do not round the variable cost figure when calculating total costs.) b) Capacity analysis i) (4 marks) Prepare an analysis that highlights idle capacity costs by analyzing 20x7 total manufacturing overhead costs (Exhibit 4), similar to the approach in Topic 2.3-10. Practical capacity is 12,000 direct labour hours (Note: Round the manufacturing overhead costs to the nearest dollar; however, do not round the MPH rate calculated when calculating the total costs.) ii) (4 marks) Explain the purpose of this analysis to management and the information it provides in relation to capacity utilization. c) Based on the results of requirements 1, 2, and 3 above, briefly comment on the manufacturing costs. (2 marks) 4. Dashboard presentation of break-even options and analysis. (6 marks) Prepare a presentation and analysis of the relationship between selling price and break-even units for The-Bar based on information provided in Exhibit 9. The purpose of the presentation is to assist the management team with cost and selling price planning for 20X8. The presentation will consist of a Power BI dashboard. The appendix at the end of this project provides instructions on how to find the data and create the dashboard using Power BI. The analysis should address the following: a) Using the 20X8 budget data provided, create a Power BI dashboard similar to the one in the appendix to this project. Based on the dashboard created, prepare an analysis that addresses the following questions: i) What is the break-even in batches


