

Question: question 3 please This assignment will show you how to use cost behavior analysis to find out about nonfinancial information without even looking at the
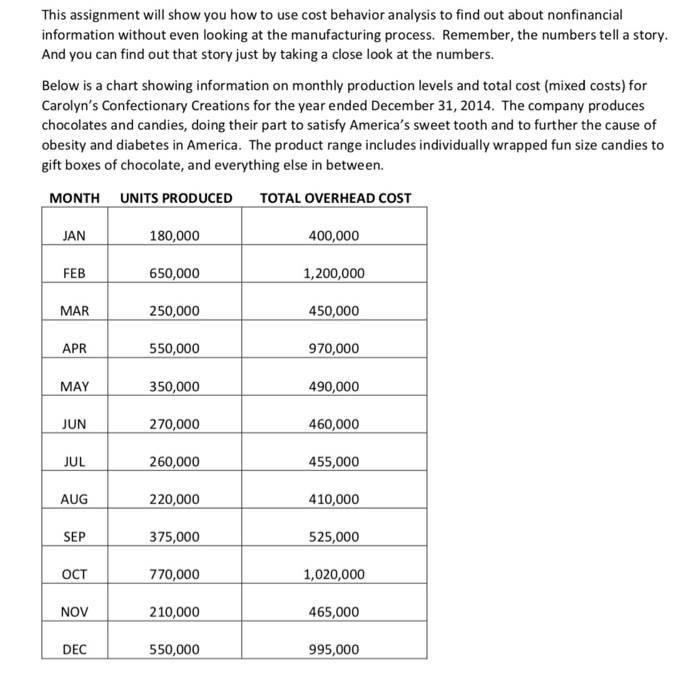
This assignment will show you how to use cost behavior analysis to find out about nonfinancial information without even looking at the manufacturing process. Remember, the numbers tell a story And you can find out that story just by taking a close look at the numbers. Below is a chart showing information on monthly production levels and total cost (mixed costs) for Carolyn's Confectionary Creations for the year ended December 31, 2014. The company produces chocolates and candies, doing their part to satisfy America's sweet tooth and to further the cause of obesity and diabetes in America. The product range includes individually wrapped fun size candies to gift boxes of chocolate, and everything else in between. MONTH UNITS PRODUCED TOTAL OVERHEAD COST JAN FEB MAR 180,000 650,000 250,000 550,000 350,000 270,000 260,000 220,000 375,000 770,000 210,000 550,000 400,000 1,200,000 50,000 970,000 490,000 460,000 55,000 410,000 525,000 1,020,000 465,000 995,000 APR MAY JUN JUL AUG SEP NOV DEC
Step by Step Solution
There are 3 Steps involved in it

Get step-by-step solutions from verified subject matter experts