Question: Question 3: Provide a summary and analysis for each ratio . The ratio numbers have been pre-filled from your ratio calculations. . Areas in which
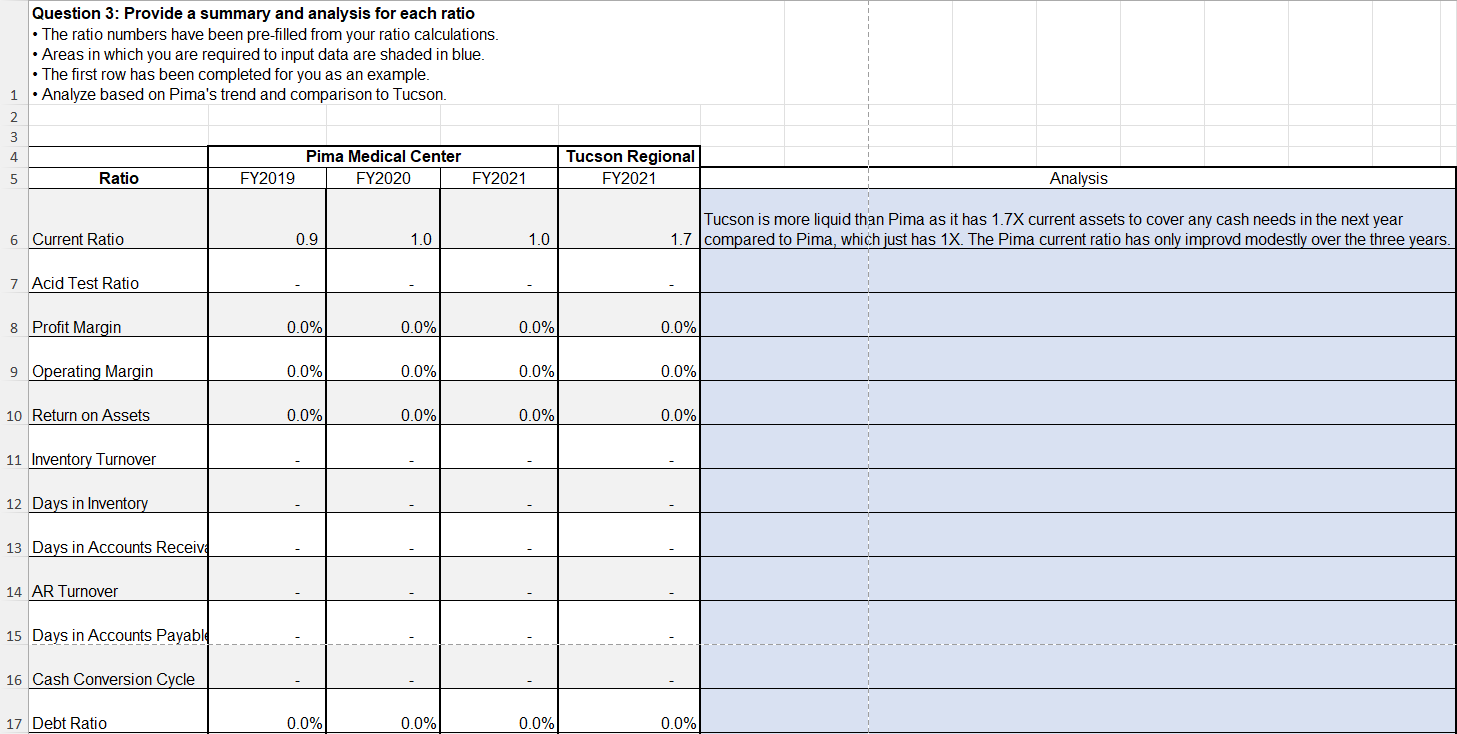
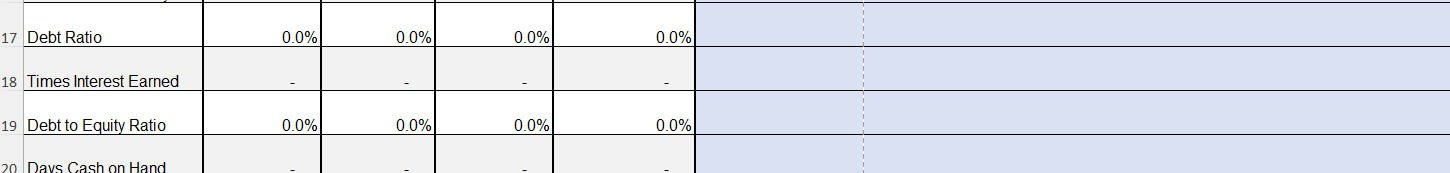
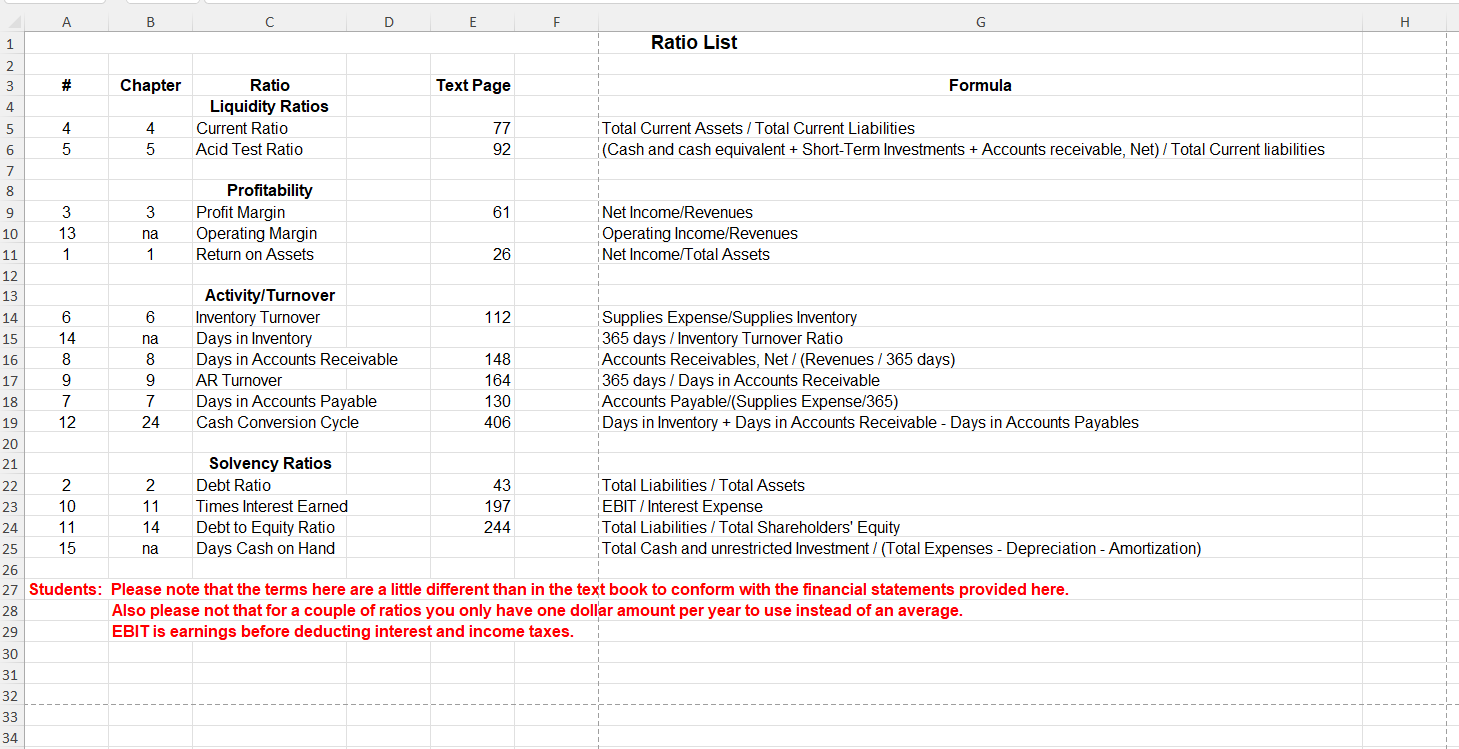
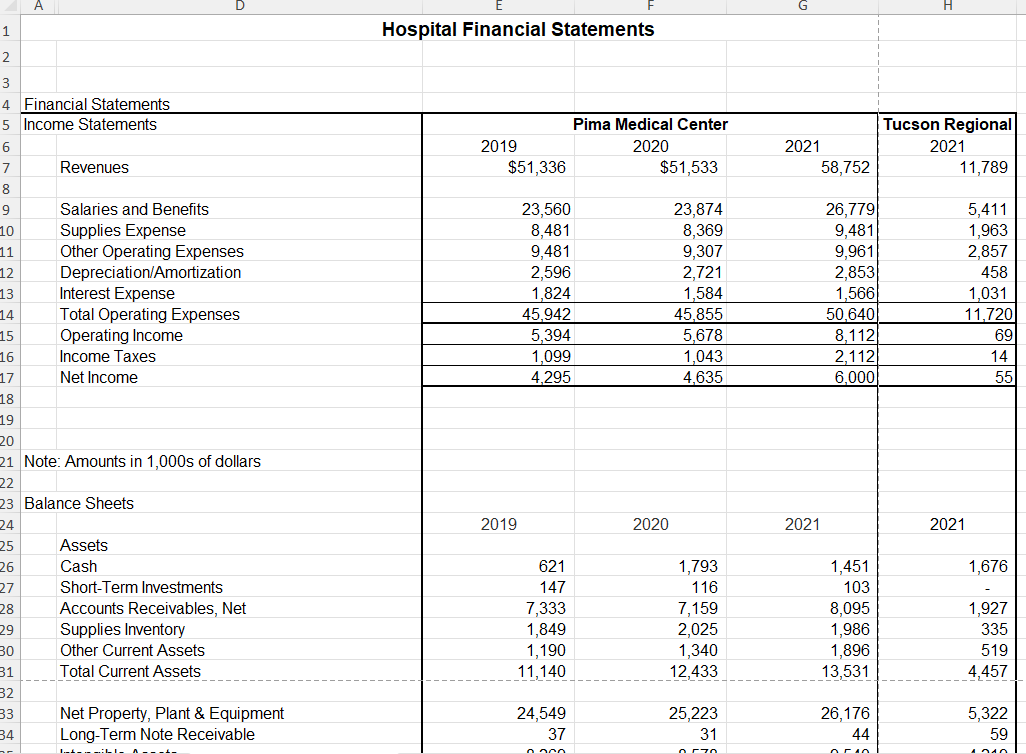
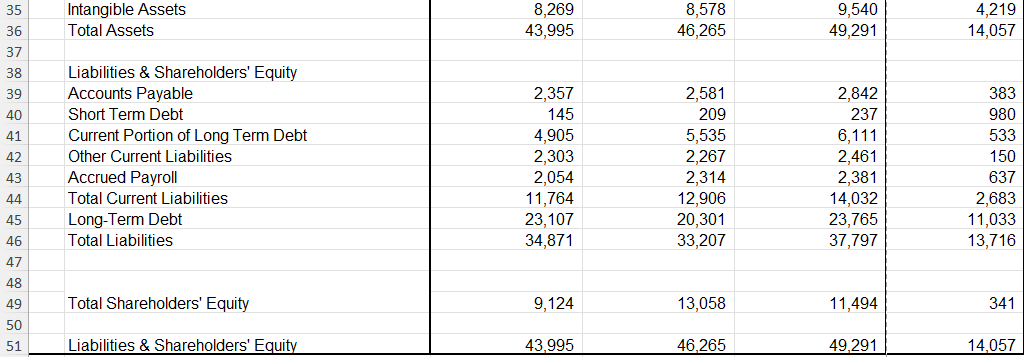
Question 3: Provide a summary and analysis for each ratio . The ratio numbers have been pre-filled from your ratio calculations. . Areas in which you are required to input data are shaded in blue. . The first row has been completed for you as an example. . Analyze based on Pima's trend and comparison to Tucson. N Pima Medical Center Tucson Regional Ratio FY2019 FY2020 FY2021 FY2021 Analysis Tucson is more liquid than Pima as it has 1.7X current assets to cover any cash needs in the next year 6 Current Ratio 0.9 1.0 1.0 1.7 compared to Pima, which just has 1X. The Pima current ratio has only improvd modestly over the three years 7 Acid Test Ratio 8 Profit Margin 0.0% 0.0% 0.0% 0.0% 9 Operating Margin 0.0% 0.0% 0.0% 0.0% 10 Return on Assets 0.0% 0.0% 0.0% 0.0% 11 Inventory Turnover 12 Days in Inventory 13 Days in Accounts Receive 14 AR Turnover 15 Days in Accounts Payable 16 Cash Conversion Cycle 17 Debt Ratio 0.0% 0.0% 0.0% 0.0%17 Debt Ratio 0.0% 0.0% 0.0% 0.0% 18 Times Interest Earned 19 Debt to Equity Ratio 0.0% 0.0% 0.0% 0.0%A B C D E F G H Ratio List Chapter Ratio Text Page Formula JOUAWNA Liquidity Ratios Current Ratio 77 Total Current Assets / Total Current Liabilities Acid Test Ratio 92 (Cash and cash equivalent + Short-Term Investments + Accounts receivable, Net) / Total Current liabilities Profitability LD DO CO 3 Profit Margin 61 Net Income/Revenues 13 na Operating Margin Operating Income/Revenues 1 Return on Assets 26 Net Income/Total Assets Activity/Turnover 14 6 6 Inventory Turnover 112 Supplies Expense/Supplies Inventory 14 na Days in Inventory 365 days / Inventory Turnover Ratio 8 Days in Accounts Receivable 148 Accounts Receivables, Net / (Revenues / 365 days) 9 AR Turnover 164 365 days / Days in Accounts Receivable 7 Days in Accounts Payable 130 Accounts Payable/(Supplies Expense/365) 12 24 Cash Conversion Cycle 406 Days in Inventory + Days in Accounts Receivable - Days in Accounts Payables 20 21 Solvency Ratios 22 2 2 Debt Ratio 43 Total Liabilities / Total Assets 23 10 11 Times Interest Earned 197 EBIT / Interest Expense 24 11 14 Debt to Equity Ratio 244 Total Liabilities / Total Shareholders' Equity 25 15 na Days Cash on Hand Total Cash and unrestricted Investment / (Total Expenses - Depreciation - Amortization) 26 27 Students: Please note that the terms here are a little different than in the text book to conform with the financial statements provided here. 28 Also please not that for a couple of ratios you only have one dollar amount per year to use instead of an average. 29 EBIT is earnings before deducting interest and income taxes. 30 31 32 33 34Hospital Financial Statements Financial Statements Income Statements Pima Medical Center Tucson Regional 6 2019 2020 2021 2021 Revenues $51,336 $51,533 58,752 11,789 Salaries and Benefits 23,560 23,874 26,779 5,411 Supplies Expense 8,481 8,369 9,481 1,963 Other Operating Expenses 9,481 9,307 9,961 2,857 Depreciation/Amortization 2,596 2,721 2,853 458 Interest Expense 1,824 1,584 1,566 1,031 14 Total Operating Expenses 45,942 45.855 50,640 11,720 15 Operating Income 5,394 5,678 8, 112 59 16 Income Taxes 1,099 1,043 2,112 14 17 Net Income 4,295 4,635 6,000 55 18 19 Note: Amounts in 1,000s of dollars 2 Balance Sheets 24 2019 2020 2021 2021 Assets Cash 621 1,793 1,451 1,676 Short-Term Investments 147 116 103 Accounts Receivables, Net 7,333 7,159 8,095 1,927 29 Supplies Inventory 1,849 2,025 1,986 335 30 Other Current Assets 1,190 1,340 1,896 519 Total Current Assets 11, 140 12,433 13,531 4,457 32 Net Property, Plant & Equipment 24,549 25,223 26, 176 5,322 34 Long-Term Note Receivable 37 31 44 5935 Intangible Assets 8,269 8,578 9,540 4,219 36 Total Assets 43,995 46,265 49,291 14,057 37 38 Liabilities & Shareholders' Equity 39 Accounts Payable 2,357 2,581 2,842 383 40 Short Term Debt 145 209 237 980 41 Current Portion of Long Term Debt 4,905 5,535 6,111 533 42 Other Current Liabilities 2,303 2,267 2,461 150 43 Accrued Payroll 2,054 2,314 2,381 637 44 Total Current Liabilities 11,764 12,906 14,032 2,683 45 Long-Term Debt 23,107 20,301 23,765 11,033 46 Total Liabilities 34,871 33,207 37,797 13,716 47 48 49 Total Shareholders' Equity 9,124 13,058 11,494 341 50 51 Liabilities & Shareholders' Equity 43,995 46,265 49,291 14,057
Step by Step Solution
There are 3 Steps involved in it
1 Expert Approved Answer
Step: 1 Unlock
Question Has Been Solved by an Expert!
Get step-by-step solutions from verified subject matter experts
Step: 2 Unlock
Step: 3 Unlock
Students Have Also Explored These Related Accounting Questions!