Question: Question 3 Read the case study below and answer the questions that follow. MicroMedium Inc. is a not-for-profit organisation that provides capacity building support to
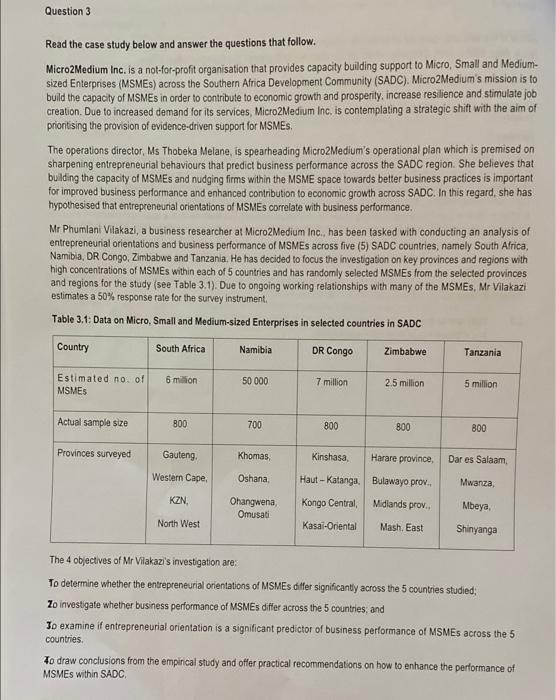
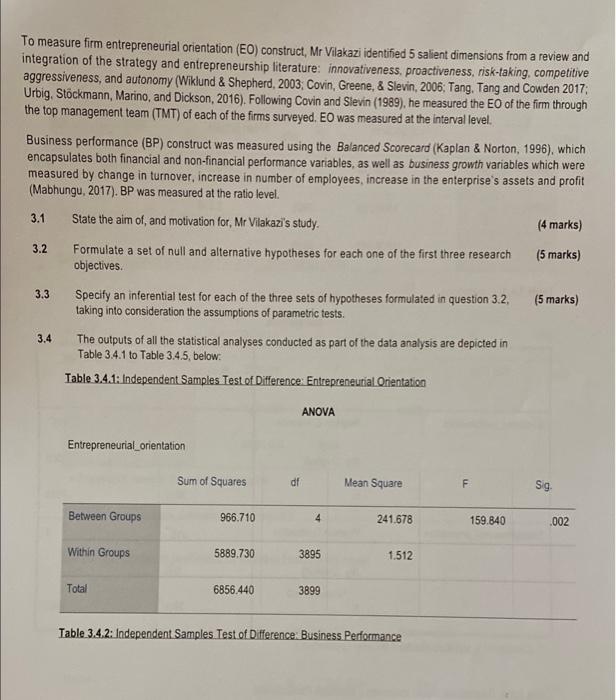
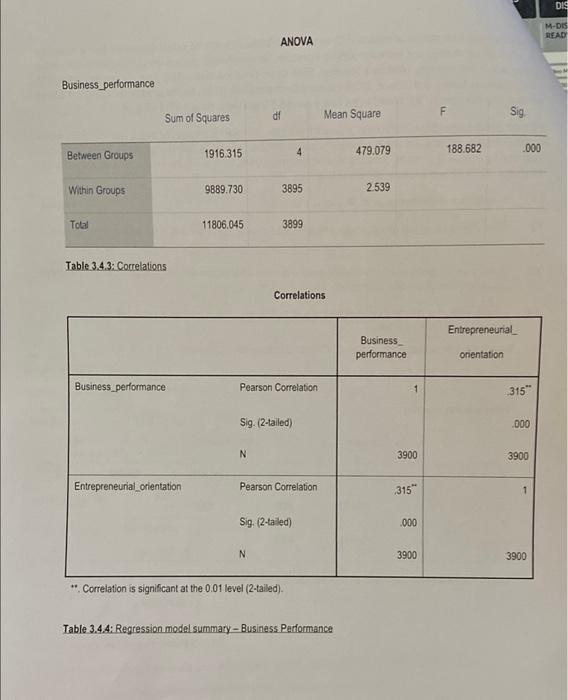
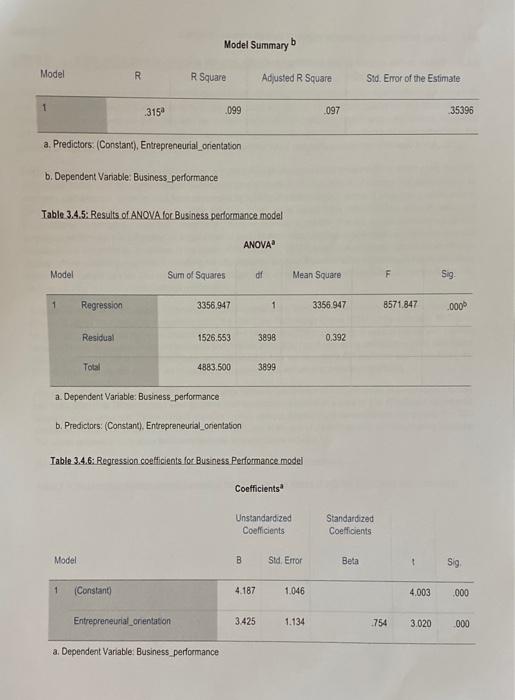
Question 3 Read the case study below and answer the questions that follow. MicroMedium Inc. is a not-for-profit organisation that provides capacity building support to Micro, Small and Medium- sized Enterprises (MSMEs) across the Southern Africa Development Community (SADC). Micro2Medium's mission is to build the capacity of MSMEs in order to contribute to economic growth and prosperity, increase resilience and stimulate job creation. Due to increased demand for its services, MicroMedium Inc. is contemplating a strategic shift with the aim of prioritising the provision of evidence-driven support for MSMEs. The operations director, Ms Thobeka Melane, is spearheading Micro2Medium's operational plan which is premised on sharpening entrepreneurial behaviours that predict business performance across the SADC region. She believes that building the capacity of MSMEs and nudging firms within the MSME space towards better business practices is important for improved business performance and enhanced contribution to economic growth across SADC. In this regard, she has hypothesised that entrepreneurial orientations of MSMEs correlate with business performance. Mr Phumlani Vilakazi, a business researcher at Micro2Medium Inc., has been tasked with conducting an analysis of entrepreneurial orientations and business performance of MSMEs across five (5) SADC countries, namely South Africa, Namibia, DR Congo, Zimbabwe and Tanzania. He has decided to focus the investigation on key provinces and regions with high concentrations of MSMEs within each of 5 countries and has randomly selected MSMEs from the selected provinces and regions for the study (see Table 3.1). Due to ongoing working relationships with many of the MSMEs, Mr Vilakazi estimates a 50% response rate for the survey instrument Table 3.1: Data on Micro, Small and Medium-sized Enterprises in selected countries in SADC Country South Africa Namibia DR Congo Zimbabwe Tanzania Estimated no. of MSMES 6 million 50 000 7 million 2.5 million 5 million Actual sample size 800 700 800 800 800 Provinces surveyed Gauteng Khomas Kinshasa Harare province Dar es Salaam Western Cape Oshana, Haut-Katanga. Bulawayo prov.. Mwanza KZN Ohangwena Omusati Kongo Central Midlands prov. Mbeya North West Kasal-Oriental Mash. East Shinyanga The 4 objectives of Mr Vilakazi's investigation are: To determine whether the entrepreneurial orientations of MSMEs differ significantly across the 5 countries studied Zo investigate whether business performance of MSMEs differ across the 5 countries, and Jo examine if entrepreneurial orientation is a significant predictor of business performance of MSMEs across the 5 countries 4o draw conclusions from the empirical study and offer practical recommendations on how to enhance the performance of MSMEs within SADC To measure firm entrepreneurial orientation (EO) construct, Mr Vilakazi identified 5 salient dimensions from a review and integration of the strategy and entrepreneurship literature: innovativeness, proactiveness, risk-taking, competitive aggressiveness, and autonomy (Wiklund & Shepherd, 2003, Covin, Greene, & Slevin, 2006; Tang, Tang and Cowden 2017, Urbig, Stockmann, Marino, and Dickson, 2016). Following Covin and Slevin (1989), he measured the EO of the firm through the top management team (TMT) of each of the firms surveyed. EO was measured at the interval level. Business performance (BP) construct was measured using the Balanced Scorecard (Kaplan & Norton, 1996), which encapsulates both financial and non-financial performance variables, as well as business growth variables which were measured by change in turnover, increase in number of employees, increase in the enterprise's assets and profit (Mabhungu, 2017). BP was measured at the ratio level. 3.1 State the aim of, and motivation for, Mr Vilakazi's study. (4 marks) 3.2 Formulate a set of null and alternative hypotheses for each one of the first three research (5 marks) objectives. 3.3 Specify an inferential test for each of the three sets of hypotheses formulated in question 3.2. (5 marks) taking into consideration the assumptions of parametric tests. 3.4 The outputs of all the statistical analyses conducted as part of the data analysis are depicted in Table 3.4.1 to Table 3.4.5, below: Table 3.4.1: Independent Samples Test of Difference Entrepreneurial. Orientation ANOVA Entrepreneurial_orientation Sum of Squares df Mean Square F Sig Between Groups 966.710 4 241.678 159.840 .002 Within Groups 5889.730 3895 1.512 Total 6856.440 3899 Table 3.4.2: Independent Samples Test of Difference Business Performance DIS M-DIS READ 89 ANOVA Business performance df Sum of Squares F Mean Square Sig 1916.315 4 Between Groups 479.079 188.682 .000 Within Groups 9889.730 3895 2.539 Total 11806.045 3899 Table 3.4.3: Correlations Correlations Entrepreneurial Business performance orientation Business performance Pearson Correlation 315" Sig (2-tailed) .000 N 3900 3900 Entrepreneurial orientation Pearson Correlation 315" 1 Sig. (2-tailed) .000 N 3900 3900 "Correlation is significant at the 0.01 level (2-tailed). Table 3.4.4: Regression model summary - Business Performance Model Summary b Model R R Square Adjusted R Square Std. Error of the Estimate 1 3150 .099 097 35396 a. Predictors: (Constant), Entrepreneurial_orientation b. Dependent Variable: Business performance Table 3.4.5: Results of ANOVA for Business performance model ANOVA Model Sum of Squares df Mean Square F Sig 1 Regression 3356,947 1 3356.947 8571.847 .000 Residual 1526.553 3898 0.392 Total 4883.500 3899 a. Dependent Variable: Business performance b. Predictors: (Constant). Entrepreneurial_onentation Table 3.4.6: Regression coefficients for Business Performance model Coefficients Unstandardized Coefficients Standardized Coefficients Model B Sid Error Beta " Sig 1 (Constant 4.187 1.046 4.003 000 Entrepreneurial_orientation 3.425 1.134 754 3.020 000 a. Dependent Variable: Business performance E (3 marks) 3.4.1 Based on the output, discuss the validity of the data analysis conducted. (3 marks) 3.4.2 Based on the outputs of the statistical analyses, provide a statistical conclusion and a management interpretation Question 3 Read the case study below and answer the questions that follow. MicroMedium Inc. is a not-for-profit organisation that provides capacity building support to Micro, Small and Medium- sized Enterprises (MSMEs) across the Southern Africa Development Community (SADC). Micro2Medium's mission is to build the capacity of MSMEs in order to contribute to economic growth and prosperity, increase resilience and stimulate job creation. Due to increased demand for its services, MicroMedium Inc. is contemplating a strategic shift with the aim of prioritising the provision of evidence-driven support for MSMEs. The operations director, Ms Thobeka Melane, is spearheading Micro2Medium's operational plan which is premised on sharpening entrepreneurial behaviours that predict business performance across the SADC region. She believes that building the capacity of MSMEs and nudging firms within the MSME space towards better business practices is important for improved business performance and enhanced contribution to economic growth across SADC. In this regard, she has hypothesised that entrepreneurial orientations of MSMEs correlate with business performance. Mr Phumlani Vilakazi, a business researcher at Micro2Medium Inc., has been tasked with conducting an analysis of entrepreneurial orientations and business performance of MSMEs across five (5) SADC countries, namely South Africa, Namibia, DR Congo, Zimbabwe and Tanzania. He has decided to focus the investigation on key provinces and regions with high concentrations of MSMEs within each of 5 countries and has randomly selected MSMEs from the selected provinces and regions for the study (see Table 3.1). Due to ongoing working relationships with many of the MSMEs, Mr Vilakazi estimates a 50% response rate for the survey instrument Table 3.1: Data on Micro, Small and Medium-sized Enterprises in selected countries in SADC Country South Africa Namibia DR Congo Zimbabwe Tanzania Estimated no. of MSMES 6 million 50 000 7 million 2.5 million 5 million Actual sample size 800 700 800 800 800 Provinces surveyed Gauteng Khomas Kinshasa Harare province Dar es Salaam Western Cape Oshana, Haut-Katanga. Bulawayo prov.. Mwanza KZN Ohangwena Omusati Kongo Central Midlands prov. Mbeya North West Kasal-Oriental Mash. East Shinyanga The 4 objectives of Mr Vilakazi's investigation are: To determine whether the entrepreneurial orientations of MSMEs differ significantly across the 5 countries studied Zo investigate whether business performance of MSMEs differ across the 5 countries, and Jo examine if entrepreneurial orientation is a significant predictor of business performance of MSMEs across the 5 countries 4o draw conclusions from the empirical study and offer practical recommendations on how to enhance the performance of MSMEs within SADC To measure firm entrepreneurial orientation (EO) construct, Mr Vilakazi identified 5 salient dimensions from a review and integration of the strategy and entrepreneurship literature: innovativeness, proactiveness, risk-taking, competitive aggressiveness, and autonomy (Wiklund & Shepherd, 2003, Covin, Greene, & Slevin, 2006; Tang, Tang and Cowden 2017, Urbig, Stockmann, Marino, and Dickson, 2016). Following Covin and Slevin (1989), he measured the EO of the firm through the top management team (TMT) of each of the firms surveyed. EO was measured at the interval level. Business performance (BP) construct was measured using the Balanced Scorecard (Kaplan & Norton, 1996), which encapsulates both financial and non-financial performance variables, as well as business growth variables which were measured by change in turnover, increase in number of employees, increase in the enterprise's assets and profit (Mabhungu, 2017). BP was measured at the ratio level. 3.1 State the aim of, and motivation for, Mr Vilakazi's study. (4 marks) 3.2 Formulate a set of null and alternative hypotheses for each one of the first three research (5 marks) objectives. 3.3 Specify an inferential test for each of the three sets of hypotheses formulated in question 3.2. (5 marks) taking into consideration the assumptions of parametric tests. 3.4 The outputs of all the statistical analyses conducted as part of the data analysis are depicted in Table 3.4.1 to Table 3.4.5, below: Table 3.4.1: Independent Samples Test of Difference Entrepreneurial. Orientation ANOVA Entrepreneurial_orientation Sum of Squares df Mean Square F Sig Between Groups 966.710 4 241.678 159.840 .002 Within Groups 5889.730 3895 1.512 Total 6856.440 3899 Table 3.4.2: Independent Samples Test of Difference Business Performance DIS M-DIS READ 89 ANOVA Business performance df Sum of Squares F Mean Square Sig 1916.315 4 Between Groups 479.079 188.682 .000 Within Groups 9889.730 3895 2.539 Total 11806.045 3899 Table 3.4.3: Correlations Correlations Entrepreneurial Business performance orientation Business performance Pearson Correlation 315" Sig (2-tailed) .000 N 3900 3900 Entrepreneurial orientation Pearson Correlation 315" 1 Sig. (2-tailed) .000 N 3900 3900 "Correlation is significant at the 0.01 level (2-tailed). Table 3.4.4: Regression model summary - Business Performance Model Summary b Model R R Square Adjusted R Square Std. Error of the Estimate 1 3150 .099 097 35396 a. Predictors: (Constant), Entrepreneurial_orientation b. Dependent Variable: Business performance Table 3.4.5: Results of ANOVA for Business performance model ANOVA Model Sum of Squares df Mean Square F Sig 1 Regression 3356,947 1 3356.947 8571.847 .000 Residual 1526.553 3898 0.392 Total 4883.500 3899 a. Dependent Variable: Business performance b. Predictors: (Constant). Entrepreneurial_onentation Table 3.4.6: Regression coefficients for Business Performance model Coefficients Unstandardized Coefficients Standardized Coefficients Model B Sid Error Beta " Sig 1 (Constant 4.187 1.046 4.003 000 Entrepreneurial_orientation 3.425 1.134 754 3.020 000 a. Dependent Variable: Business performance E (3 marks) 3.4.1 Based on the output, discuss the validity of the data analysis conducted. (3 marks) 3.4.2 Based on the outputs of the statistical analyses, provide a statistical conclusion and a management interpretation