

Question: QUESTION 3 STOCK VALUATION: (20 Marks) - Use the spreadsheet Q2-Stock-FLT.xlsx on Blackboard to complete this question. The spreadsheet contains information output from Bloomberg Terminal.
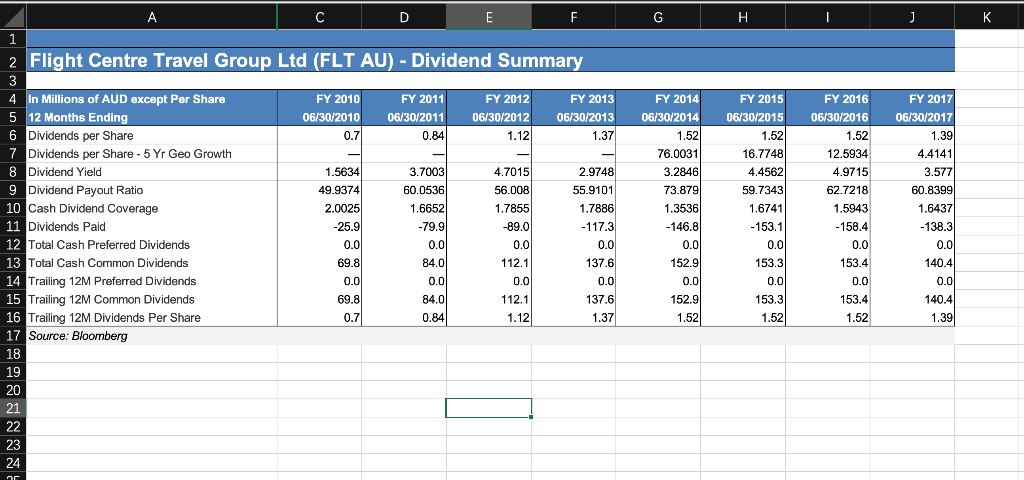
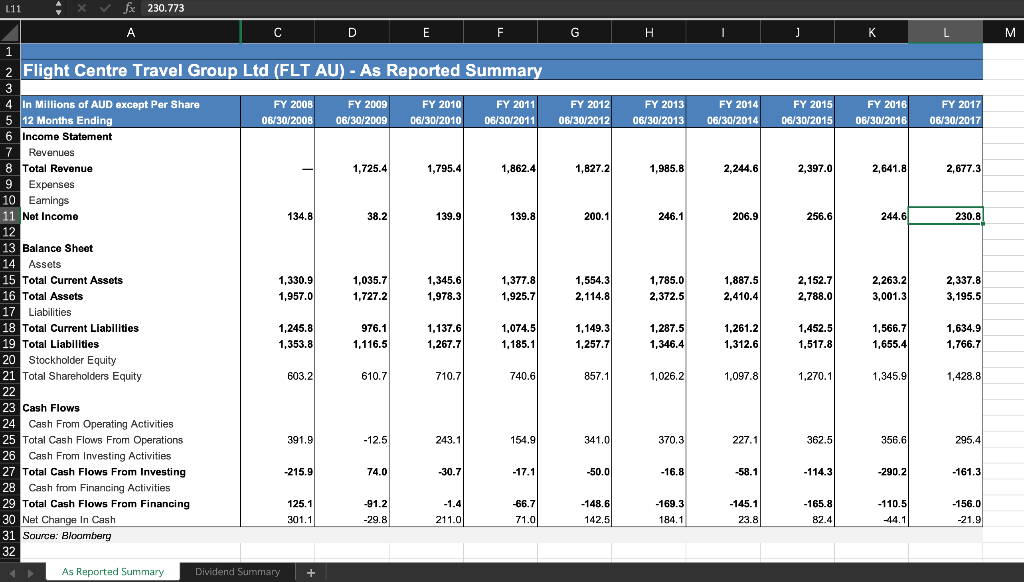
QUESTION 3 STOCK VALUATION: (20 Marks) - Use the spreadsheet Q2-Stock-FLT.xlsx on Blackboard to complete this question. The spreadsheet contains information output from Bloomberg Terminal. - All financial statement numbers are in millions of dollars unless otherwise indicated. - Assume today is 30th June 2017 and you have just been paid a dividend and that the next dividend will be received in exactly one year (assume dividend is paid annually). - The stock price as at 30th June 2017 was $38.30. a) You expect Flight Centre Ltd. to maintain the same dividend payout ratio as at 30th June 2017 for the next three years. After three years, the company will increase the dividend payout ratio to 70%. Assume company's return on new investment is 16.6% and the required rate of return is 10%. Using the dividend discount model, calculate the intrinsic value for stock today. (5 marks) b) Based on your answer in Part (a), would you recommend to buy, sell or hold the stock? Give the recommendation and briefly discuss the difference between the intrinsic value and stock price. (no more than 200 words) (3 marks) c) Calculate the following ratios for financial year ending at 30th June 2017 - Forward Price-Earnings Ratio and Trailing Price Earnings Ratio. Briefly discuss the difference between these two ratios. - If the stock was fairly priced according to the dividend discount model, what would be its Price- Earnings ratio (both Forward and Trailing)? - The P/E ratio of the S&P/ASX 200 Consumer Discretionary Sector GICS Level 1 Index is 25.07 as at the end of financial year of 2017, use this number as the average industry P/E ratio for Flight Centre. Comparing your estimate of P/E ratio for Flight Centre with the industry average P/E ratio, what conclusion could you make? (6 marks) Now assume you bought this share two years ago: d) If you bought share in the company on the 1st July 2015 at $34 and the share price exactly one year ago was $31, what is your capital gain per share today? (2 mark) e) Use the information in part (d), if you reinvested the dividends you received in more FLT shares, what is your wealth on 30th June 2017 on a per share basis? Assume that you have bought 1000 shares. (4 marks) G H I J K 010 0.71 C D E F F 1 2 Flight Centre Travel Group Ltd (FLT AU) - Dividend Summary 3 4 In Millions of AUD except Per Share FY 2010 FY 2011 FY 2012 FY 2013 5 12 Months Ending 06/30/2010 06/30/2012 06/30/2013 06/30/2013 6 Dividends per Share 0.84 1.12 1.37 7 Dividends per Share - 5 Yr Geo Growth 8 Dividend Yield 1.5634 3.7003 4.7015 2.9748 9 Dividend Payout Ratio 49.9374 60.0536 56.008 55.9101 10 Cash Dividend Coverage 2.0025 1.6652 1.7855 1.7886 11 Dividends Paid -25.9 -79.9 -89.0 -117.3 12 Total Cash Preferred Dividends 0.0 0.0 0.0 13 Total Cash Common Dividends 84.0 112.1 137.6 14 Trailing 12M Preferred Dividends 0.0 0.0 0.0 15 Trailing 12M Common Dividends 84.0 112.1 137.6 16 Trailing 12M Dividends Per Share 0.84 1.12 1.37 17 Source: Bloomberg 18 FY 2014 06/30/2014 1.52 76.0031 3.2846 73.879 1.3536 - 146.8 0.0 152.9 0.0 152.9 1.52 FY 2015 06/30/2015 1.52 16.7748 4.4562 59.7343 1.6741 FY 2016 06/30/2016 1.52 12.5934 4.9715 62.7218 1.5943 -158.4 0.0 153.4 0.0 153.4 1.52 FY 2017 06/30/2017 1.39 4.4141 3.577 60.8399 1.6437 -138.3 0.00 140.4 0.01 140.4 1.39 -153.1 0.0 0.0 153.3 153.3 1.52 111 x v fx 230.773 C D E F G H J K L M 2 Flight Centre Travel Group Ltd (FLT AU) - As Reported Summary 3 FY 2008 20 FY 2009 0 6/30/2009 FY 2010 06/30/2010 FY 2011 06/30/2011 FY 2012 06/30/2012 FY 2013 06/30/2013 FY 2014 06/30/2014 FY 2015 06/30/2015 FY 2016 06/30/2016 FY2017 0630/2017 1,725.4 1,795.4 1,862.4 1,827.2 1,985.8 2,244.6 2,397.00 2,641.8 2,677.3 134.8 38.2 139.9 139.8 200.1 246.1 206.9 256.6 244.6 230.8 1,330.9 1,035.7 1,727.2 1,345.6 1,978.3 1,377.8 1,925.7 1,554.3 2,114.8 1,785.0 2,372.5 1,887.5 2,410.4 2,152.7 2,788.0 2,263.2 3,001.3 2,337.8 3,195.5 1,957.0 A Millions of AUD except Per Share 5 12 Months Ending 6 Income Statement 7 Revenues 8 Total Revenue 9 Expenses 10 Eamings 11 Net Income 12 13 Balance Sheet 14 Assets 15 Total Current Assets 16 Total Assets 17 Liabilities 18 Total Current Liabilities 19 Total Liabilities 20 Stockholder Equity 21 Total Shareholders Equity 22 23 Cash Flows 24 Cash From Operating Activities 25 Total Cash Flows From Operations 26 Cash From Investing Activities 27 Total Cash Flows From Investing 28 Cash from Financing Activities 29 Total Cash Flows From Financing 30 Net Change In Cash 31 Source: Bloomberg 1,245.8 1,353.8 976.1 1,116.5 1,137.6 1.267.7 1,074.5 1,185.1 1,149.3 1,257.7 1,287.5 1,346.4 1,261.2 1,312.6 1,452.51 1,517.8 1,566.7 1,655.4 1,634.9 1,766.7 603.2 610.7 710.71 740.6 857.1 1,026.2 1,097.8 1,270.1 1,345.9 1,428.8 391.9 243.1 154.9 341.00 370.3 7.11 362.5 356.6 295.4 -215.9 74.0 -30.7 -17.1 -50.0 -16.8 -114.3 -290.2 -161.3 66.7 125.1 301.1 -91.2 -29.8 -148.6 142.5 -169.3 184.1 -165.8 82.4 -110.5 44.11 -156.0 -21.9 211.01 71.0 23.8 As Reported Summary Dividend Summary + QUESTION 3 STOCK VALUATION: (20 Marks) - Use the spreadsheet Q2-Stock-FLT.xlsx on Blackboard to complete this question. The spreadsheet contains information output from Bloomberg Terminal. - All financial statement numbers are in millions of dollars unless otherwise indicated. - Assume today is 30th June 2017 and you have just been paid a dividend and that the next dividend will be received in exactly one year (assume dividend is paid annually). - The stock price as at 30th June 2017 was $38.30. a) You expect Flight Centre Ltd. to maintain the same dividend payout ratio as at 30th June 2017 for the next three years. After three years, the company will increase the dividend payout ratio to 70%. Assume company's return on new investment is 16.6% and the required rate of return is 10%. Using the dividend discount model, calculate the intrinsic value for stock today. (5 marks) b) Based on your answer in Part (a), would you recommend to buy, sell or hold the stock? Give the recommendation and briefly discuss the difference between the intrinsic value and stock price. (no more than 200 words) (3 marks) c) Calculate the following ratios for financial year ending at 30th June 2017 - Forward Price-Earnings Ratio and Trailing Price Earnings Ratio. Briefly discuss the difference between these two ratios. - If the stock was fairly priced according to the dividend discount model, what would be its Price- Earnings ratio (both Forward and Trailing)? - The P/E ratio of the S&P/ASX 200 Consumer Discretionary Sector GICS Level 1 Index is 25.07 as at the end of financial year of 2017, use this number as the average industry P/E ratio for Flight Centre. Comparing your estimate of P/E ratio for Flight Centre with the industry average P/E ratio, what conclusion could you make? (6 marks) Now assume you bought this share two years ago: d) If you bought share in the company on the 1st July 2015 at $34 and the share price exactly one year ago was $31, what is your capital gain per share today? (2 mark) e) Use the information in part (d), if you reinvested the dividends you received in more FLT shares, what is your wealth on 30th June 2017 on a per share basis? Assume that you have bought 1000 shares. (4 marks) G H I J K 010 0.71 C D E F F 1 2 Flight Centre Travel Group Ltd (FLT AU) - Dividend Summary 3 4 In Millions of AUD except Per Share FY 2010 FY 2011 FY 2012 FY 2013 5 12 Months Ending 06/30/2010 06/30/2012 06/30/2013 06/30/2013 6 Dividends per Share 0.84 1.12 1.37 7 Dividends per Share - 5 Yr Geo Growth 8 Dividend Yield 1.5634 3.7003 4.7015 2.9748 9 Dividend Payout Ratio 49.9374 60.0536 56.008 55.9101 10 Cash Dividend Coverage 2.0025 1.6652 1.7855 1.7886 11 Dividends Paid -25.9 -79.9 -89.0 -117.3 12 Total Cash Preferred Dividends 0.0 0.0 0.0 13 Total Cash Common Dividends 84.0 112.1 137.6 14 Trailing 12M Preferred Dividends 0.0 0.0 0.0 15 Trailing 12M Common Dividends 84.0 112.1 137.6 16 Trailing 12M Dividends Per Share 0.84 1.12 1.37 17 Source: Bloomberg 18 FY 2014 06/30/2014 1.52 76.0031 3.2846 73.879 1.3536 - 146.8 0.0 152.9 0.0 152.9 1.52 FY 2015 06/30/2015 1.52 16.7748 4.4562 59.7343 1.6741 FY 2016 06/30/2016 1.52 12.5934 4.9715 62.7218 1.5943 -158.4 0.0 153.4 0.0 153.4 1.52 FY 2017 06/30/2017 1.39 4.4141 3.577 60.8399 1.6437 -138.3 0.00 140.4 0.01 140.4 1.39 -153.1 0.0 0.0 153.3 153.3 1.52 111 x v fx 230.773 C D E F G H J K L M 2 Flight Centre Travel Group Ltd (FLT AU) - As Reported Summary 3 FY 2008 20 FY 2009 0 6/30/2009 FY 2010 06/30/2010 FY 2011 06/30/2011 FY 2012 06/30/2012 FY 2013 06/30/2013 FY 2014 06/30/2014 FY 2015 06/30/2015 FY 2016 06/30/2016 FY2017 0630/2017 1,725.4 1,795.4 1,862.4 1,827.2 1,985.8 2,244.6 2,397.00 2,641.8 2,677.3 134.8 38.2 139.9 139.8 200.1 246.1 206.9 256.6 244.6 230.8 1,330.9 1,035.7 1,727.2 1,345.6 1,978.3 1,377.8 1,925.7 1,554.3 2,114.8 1,785.0 2,372.5 1,887.5 2,410.4 2,152.7 2,788.0 2,263.2 3,001.3 2,337.8 3,195.5 1,957.0 A Millions of AUD except Per Share 5 12 Months Ending 6 Income Statement 7 Revenues 8 Total Revenue 9 Expenses 10 Eamings 11 Net Income 12 13 Balance Sheet 14 Assets 15 Total Current Assets 16 Total Assets 17 Liabilities 18 Total Current Liabilities 19 Total Liabilities 20 Stockholder Equity 21 Total Shareholders Equity 22 23 Cash Flows 24 Cash From Operating Activities 25 Total Cash Flows From Operations 26 Cash From Investing Activities 27 Total Cash Flows From Investing 28 Cash from Financing Activities 29 Total Cash Flows From Financing 30 Net Change In Cash 31 Source: Bloomberg 1,245.8 1,353.8 976.1 1,116.5 1,137.6 1.267.7 1,074.5 1,185.1 1,149.3 1,257.7 1,287.5 1,346.4 1,261.2 1,312.6 1,452.51 1,517.8 1,566.7 1,655.4 1,634.9 1,766.7 603.2 610.7 710.71 740.6 857.1 1,026.2 1,097.8 1,270.1 1,345.9 1,428.8 391.9 243.1 154.9 341.00 370.3 7.11 362.5 356.6 295.4 -215.9 74.0 -30.7 -17.1 -50.0 -16.8 -114.3 -290.2 -161.3 66.7 125.1 301.1 -91.2 -29.8 -148.6 142.5 -169.3 184.1 -165.8 82.4 -110.5 44.11 -156.0 -21.9 211.01 71.0 23.8 As Reported Summary Dividend Summary +
Step by Step Solution
There are 3 Steps involved in it

Get step-by-step solutions from verified subject matter experts