

Question: Question 3 The below graph shows a monopolist that faces a market demand according to his cost functions. Answer all the following questions: MC $22
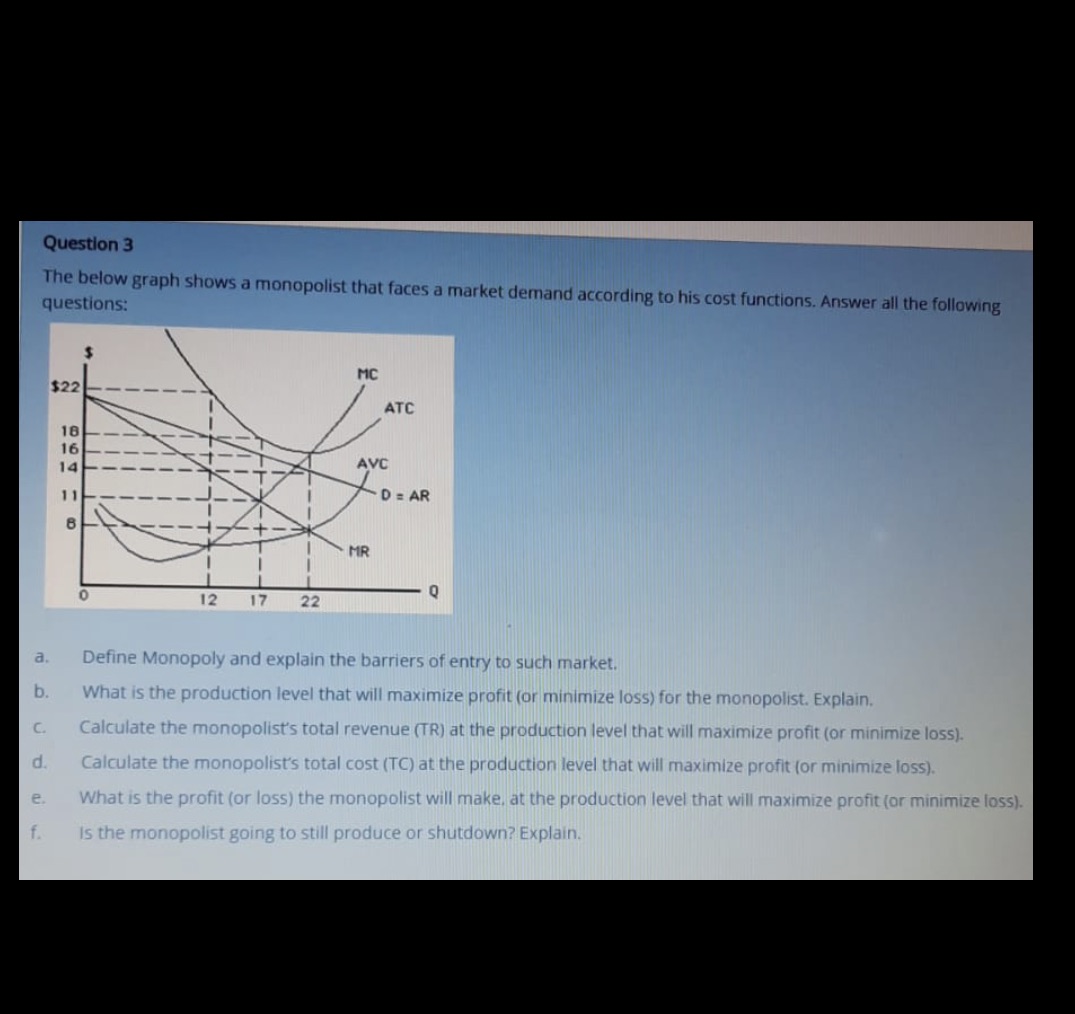

Question 3 The below graph shows a monopolist that faces a market demand according to his cost functions. Answer all the following questions: MC $22 ATC 18 16 14 AVC 1 1 -D = AR CO MR 12 17 22 a. Define Monopoly and explain the barriers of entry to such market. b. What is the production level that will maximize profit (or minimize loss) for the monopolist. Explain. C. Calculate the monopolist's total revenue (TR) at the production level that will maximize profit (or minimize loss). d. Calculate the monopolist's total cost (TC) at the production level that will maximize profit (or minimize loss). e. What is the profit (or loss) the monopolist will make, at the production level that will maximize profit (or minimize loss). f. Is the monopolist going to still produce or shutdown? Explain
Step by Step Solution
There are 3 Steps involved in it

Get step-by-step solutions from verified subject matter experts