

Question: Question 3. The data below is shown using a stern and leaf display. Please reproduce the actual data values. 1|3349 2|01115T 3|12336 4|113 Question ll]
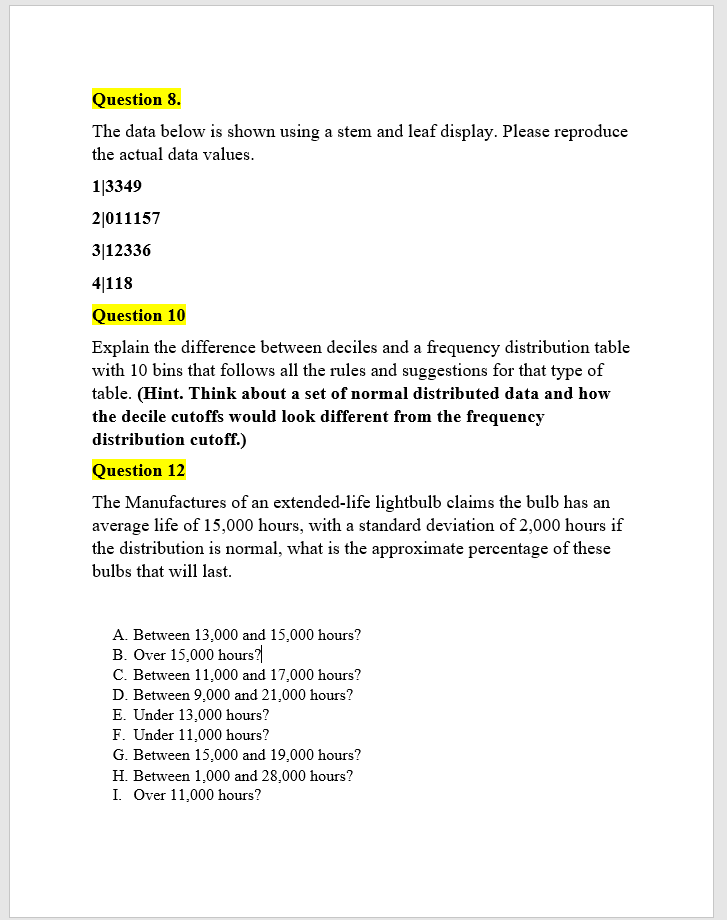
Question 3. The data below is shown using a stern and leaf display. Please reproduce the actual data values. 1|3349 2|01115T 3|12336 4|113 Question ll] Explain the difference between deciles and a frequencjg.r distribution table with 10 bins that follows all the rules and suggestions for that type of table. (Hint. Think about a set of normal distributed data and how the decile cutoffs would look different from the frequency.r distribution cutoff.) IQnes tion 12 The Manufactures of an extended-life lightbulb cla bus the bulb has an average life of 15,000 hours. with a standard deviation of 2,000 hours if the distribution is normal. what is the approximate percentage of these bulbs that will last. Between 13:000 and 15,000 hours? Over 15,000 hours?| Between 11:000' and 1?,000 hours? Between 9:000 and 21,000 hours? Under 13:000 hours? Under 11:000 hours? Between 15:000' and 19,000 hours? Between L000 and 28,000 hours? Over 11,000 hours? HFQWP'UC'W
Step by Step Solution
There are 3 Steps involved in it

Get step-by-step solutions from verified subject matter experts