

Question: Question 3 The data for question 3 is located on the worksheet named Government .The state legislature has final approval over spending from the state's
Question 3
The data for question 3 is located on the worksheet named Government.The state legislature has final approval over spending from the state's general fund.The allocations (in millions of dollars) are provided in summary form.Use the data provided in the Government worksheet to
a.6 points: In cell B7, total the budget dollars displayed in cells B2:B6.In cells C2-C6, provide formulas to calculate the proportion of the total that each budget category represents, referencing cell B7 as an absolute reference in your formulas, then format as percent, using two decimal places.
b.6 points: Construct a Pie-Chart displaying the percent of the budget that each category represents.In the Pie-Chart dialogue box, the data range is the percentages.
Chart Specifications
You should specify the range for the budget categories in the field labeled "Category Labels:"
Title the Pie-Chart "Budget Expenditures,"
Choose "Show Percent" under the tab labeled "Data Labels."
Move the chart so that it starts in cell A10.Size the chart so that it fits the red shaded area.
c.4 points:In the text box that starts in cell A29, comment on the reason a Pie-Chart was specified and the value of your chart in conveying information for decision making.
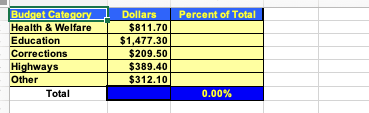
Budget Category Dollars Percent of Total Health & Welfare $811.70 Education $1,477.30 Corrections $209.50 Highways $389.40 Other $312.10 Total 0.00%%
Step by Step Solution
There are 3 Steps involved in it

Get step-by-step solutions from verified subject matter experts