

Question: QUESTION 3 The following Frequency table displays the amount spent on Grocery in BD by a number of Bahraini families, the data was presented in
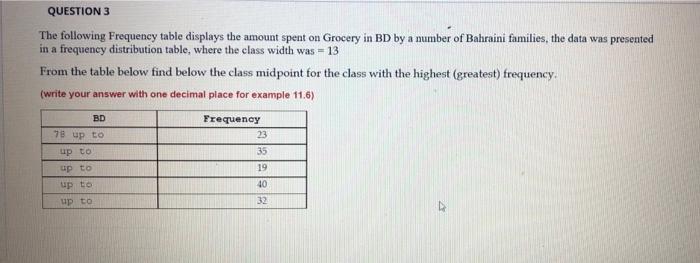
QUESTION 3 The following Frequency table displays the amount spent on Grocery in BD by a number of Bahraini families, the data was presented in a frequency distribution table, where the class width was - 13 From the table below find below the class midpoint for the class with the highest (greatest) frequency (write your answer with one decimal place for example 11.6) BD 78 up to Frequency 23 35 19 up to up to up to up to 40 32
Step by Step Solution
There are 3 Steps involved in it
1 Expert Approved Answer
Step: 1 Unlock

Question Has Been Solved by an Expert!
Get step-by-step solutions from verified subject matter experts
Step: 2 Unlock
Step: 3 Unlock