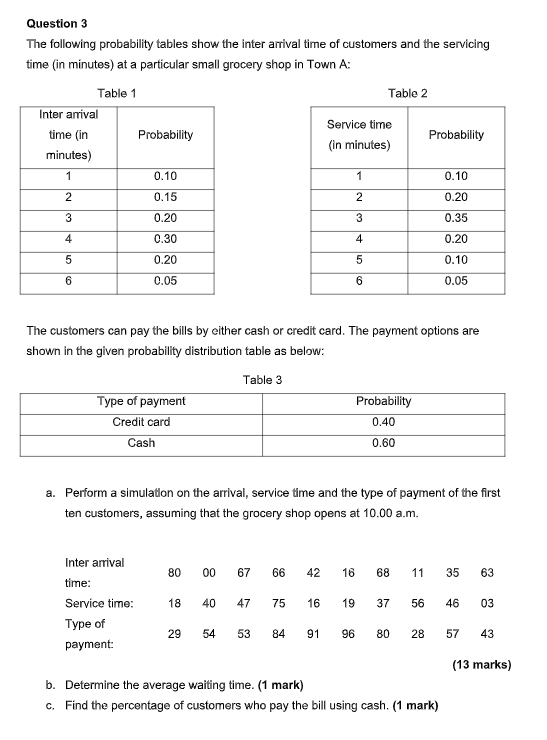
Question: Question 3 The following probability tables show the inter arrival time of customers and the servicing time (in minutes) at a particular small grocery shop

Question 3 The following probability tables show

Question 3 The following probability tables show the inter arrival time of customers and the servicing time (in minutes) at a particular small grocery shop in Town A: Table 1 Table 2 Inter arrival Service time time (in Probability Probability (in minutes) minutes) 1 0.10 0.10 1 2 0.15 2 0.20 3 0.20 3 0.35 4 0.30 4 0.20 5 0.20 5 0.10 o on 6 0.05 6 0.05 The customers can pay the bills by either cash or credit card. The payment options are shown in the given probability distribution table as below: Table 3 Type of payment Probability Credit card 0.40 Cash 0.60 a. Perform a simulation on the arrival, service time and the type of payment of the first ten customers, assuming that the grocery shop opens at 10.00 a.m. 80 00 67 66 42 16 68 11 35 63 Inter arrival time: Service time: Type of payment: 18 40 47 75 16 19 37 56 46 03 29 54 53 84 91 96 80 28 57 43 (13 marks) b. Determine the average waiting time. (1 mark) c. Find the percentage of customers who pay the bill using cash. (1 mark)

Step by Step Solution

There are 3 Steps involved in it

1 Expert Approved Answer
Step: 1 Unlock blur-text-image
Question Has Been Solved by an Expert!

Get step-by-step solutions from verified subject matter experts

Step: 2 Unlock
Step: 3 Unlock

Students Have Also Explored These Related General Management Questions!