

Question: QUESTION 3 The following table shows the prices and quantities of four raw materials used in a production process Raw material Price/kg (RM) Quantity (kg)
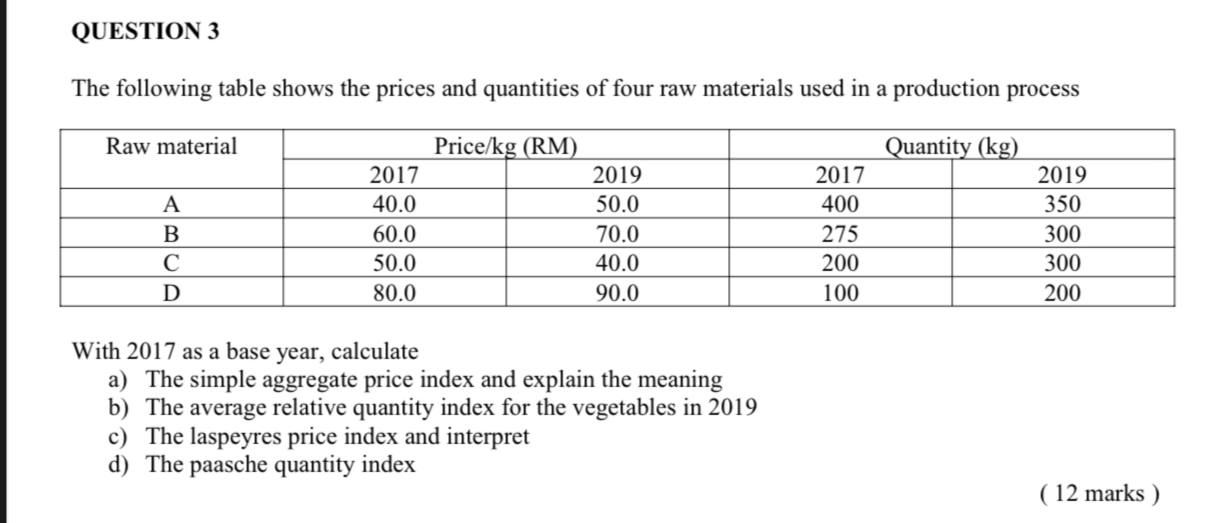
QUESTION 3 The following table shows the prices and quantities of four raw materials used in a production process Raw material Price/kg (RM) Quantity (kg) 2017 2019 2017 2019 A 40.0 50.0 400 350 B 60.0 70.0 275 300 C 50.0 40.0 200 300 D 80.0 90.0 100 200 With 2017 as a base year, calculate a) The simple aggregate price index and explain the meaning b) The average relative quantity index for the vegetables in 2019 c) The laspeyres price index and interpret d) The paasche quantity index ( 12 marks )
Step by Step Solution
There are 3 Steps involved in it
1 Expert Approved Answer
Step: 1 Unlock

Question Has Been Solved by an Expert!
Get step-by-step solutions from verified subject matter experts
Step: 2 Unlock
Step: 3 Unlock