

Question: Question 3 The table below shows data for crashing the activities of a Manufacturing Project as shown in the network diagram a . Calculate the
Question
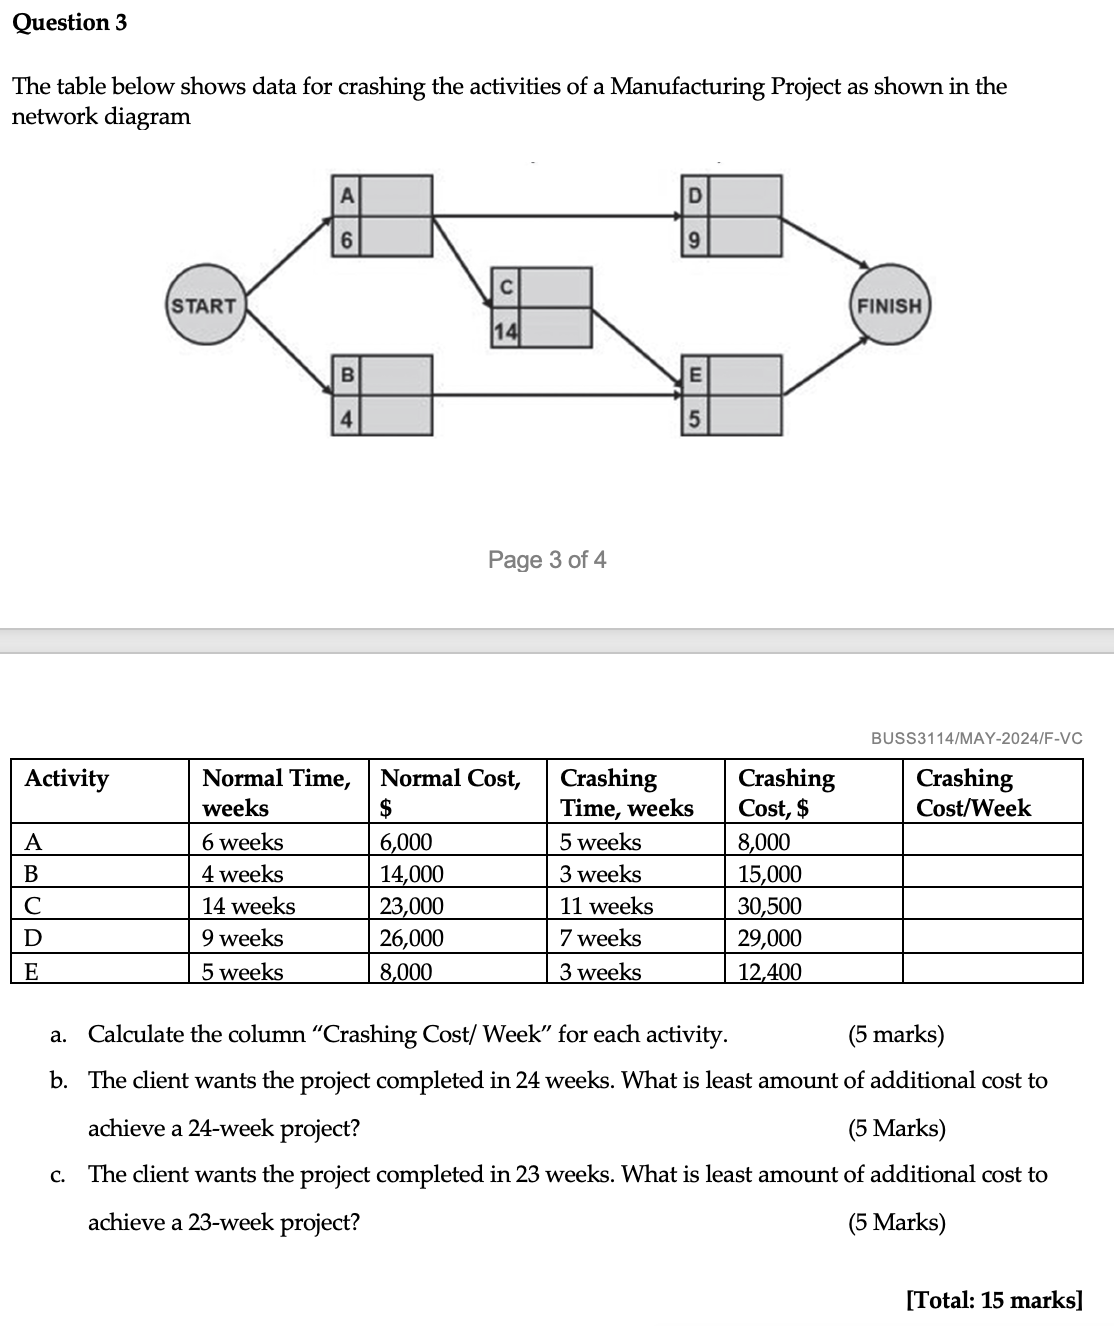
The table below shows data for crashing the activities of a Manufacturing Project as shown in the
network diagram
a Calculate the column "Crashing Cost Week" for each activity.
marks
b The client wants the project completed in weeks. What is least amount of additional cost to
achieve a week project?
c The client wants the project completed in weeks. What is least amount of additional cost to
achieve a week project?
Step by Step Solution
There are 3 Steps involved in it
1 Expert Approved Answer
Step: 1 Unlock

Question Has Been Solved by an Expert!
Get step-by-step solutions from verified subject matter experts
Step: 2 Unlock
Step: 3 Unlock